Here is the Code for this project. Link to heading
Table of Contents Link to heading
1. Intro Link to heading
2. Data Link to heading
3. Consistency Link to heading
4. Scores Link to heading
5. Location Link to heading
6, Youtube Analytics Link to heading
7. Rankings Link to heading
Intro Link to heading
Welcome To One Byte: a visual data analysis project that analyzes the data from Dave Portnoy’s One Bite Pizza series.
If you’re not familiar with the One Bite Pizza Reviews, they are a series of video reviews created by Barstool Sports founder, Dave “El Presidente” Portnoy, where he visits pizza shops and rates their pizzas on a decimal scale ranging from 1 to 10. Dave has reviewed over a thousand pizza restaurants around the world and tried all types of pizza, making his reviews a valuable resource for anyone seeking the best pizza slice.
Portnoy started his goal of reviewing every pizza place in the world in 2013 and since then has been consistently posting reviews. Portnoy popularized the catchphrase “one bite everyone knows the rules” in his pizza reviews and has created a cult-like following of people giving “one bite” pizza reviews. The One Bite Pizza videos have amassed over 350,000,000 views on YouTube, making them a popular source for pizza enthusiasts everywhere.
Along with the reviews, Portnoy has also created the One Bite App which allows for fans of the series to post their scores of the pizza as well. One Bite users can upload their own reviews at any of the 125,000+ pizza restaurants listed across the world. So far the app has collected over 200,000 unique reviews from fans around the world. The app also stores all of the data from Dave’s reviews including video links, scores, and location data.
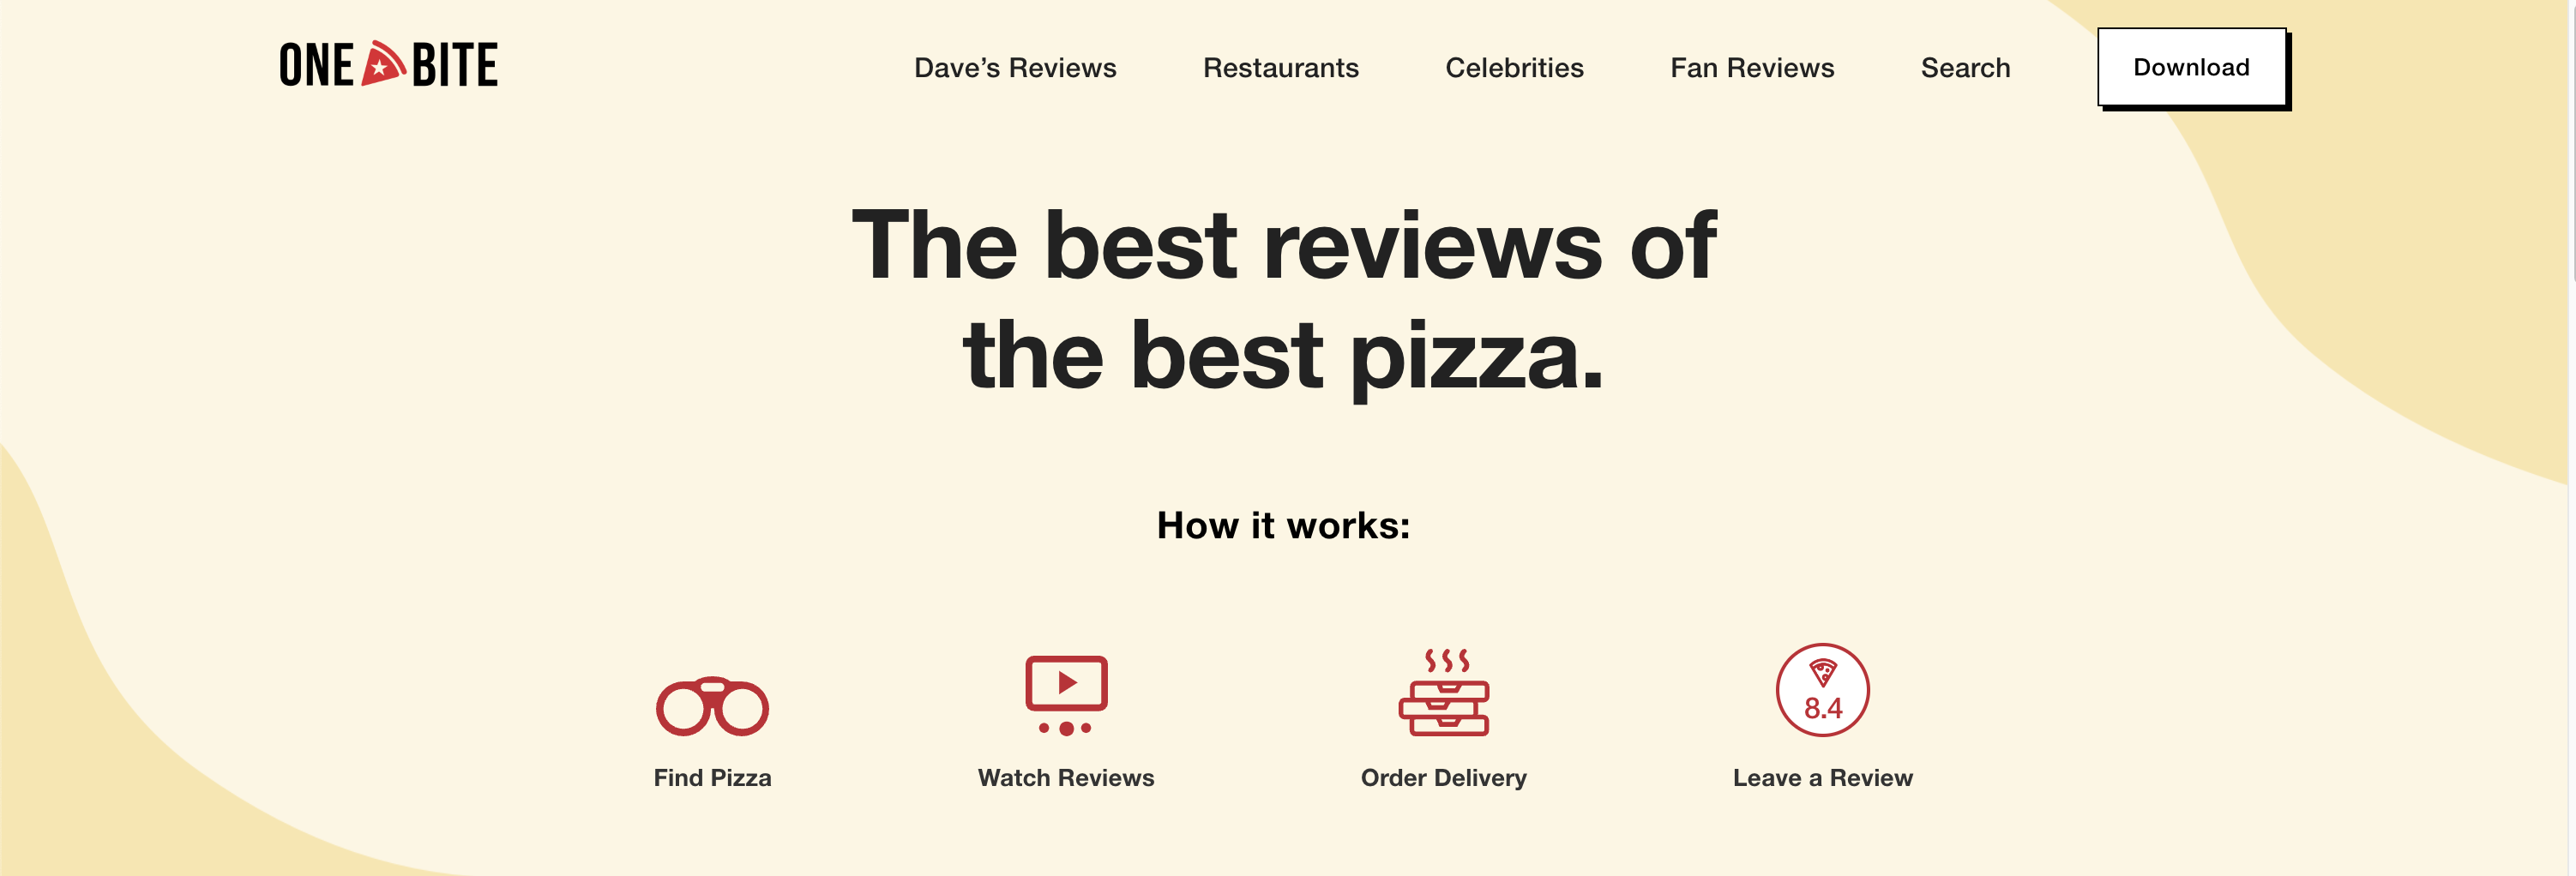
The following analysis is based on the data collected from the One Bite website and the One Bite Youtube channel. The data was collected using a web scraper that I built using Python and the BeautifulSoup library. The scraper was able to collect over 1400 links from the One Bite website and over 2000 links from the One Bite Youtube channel.
Data Link to heading
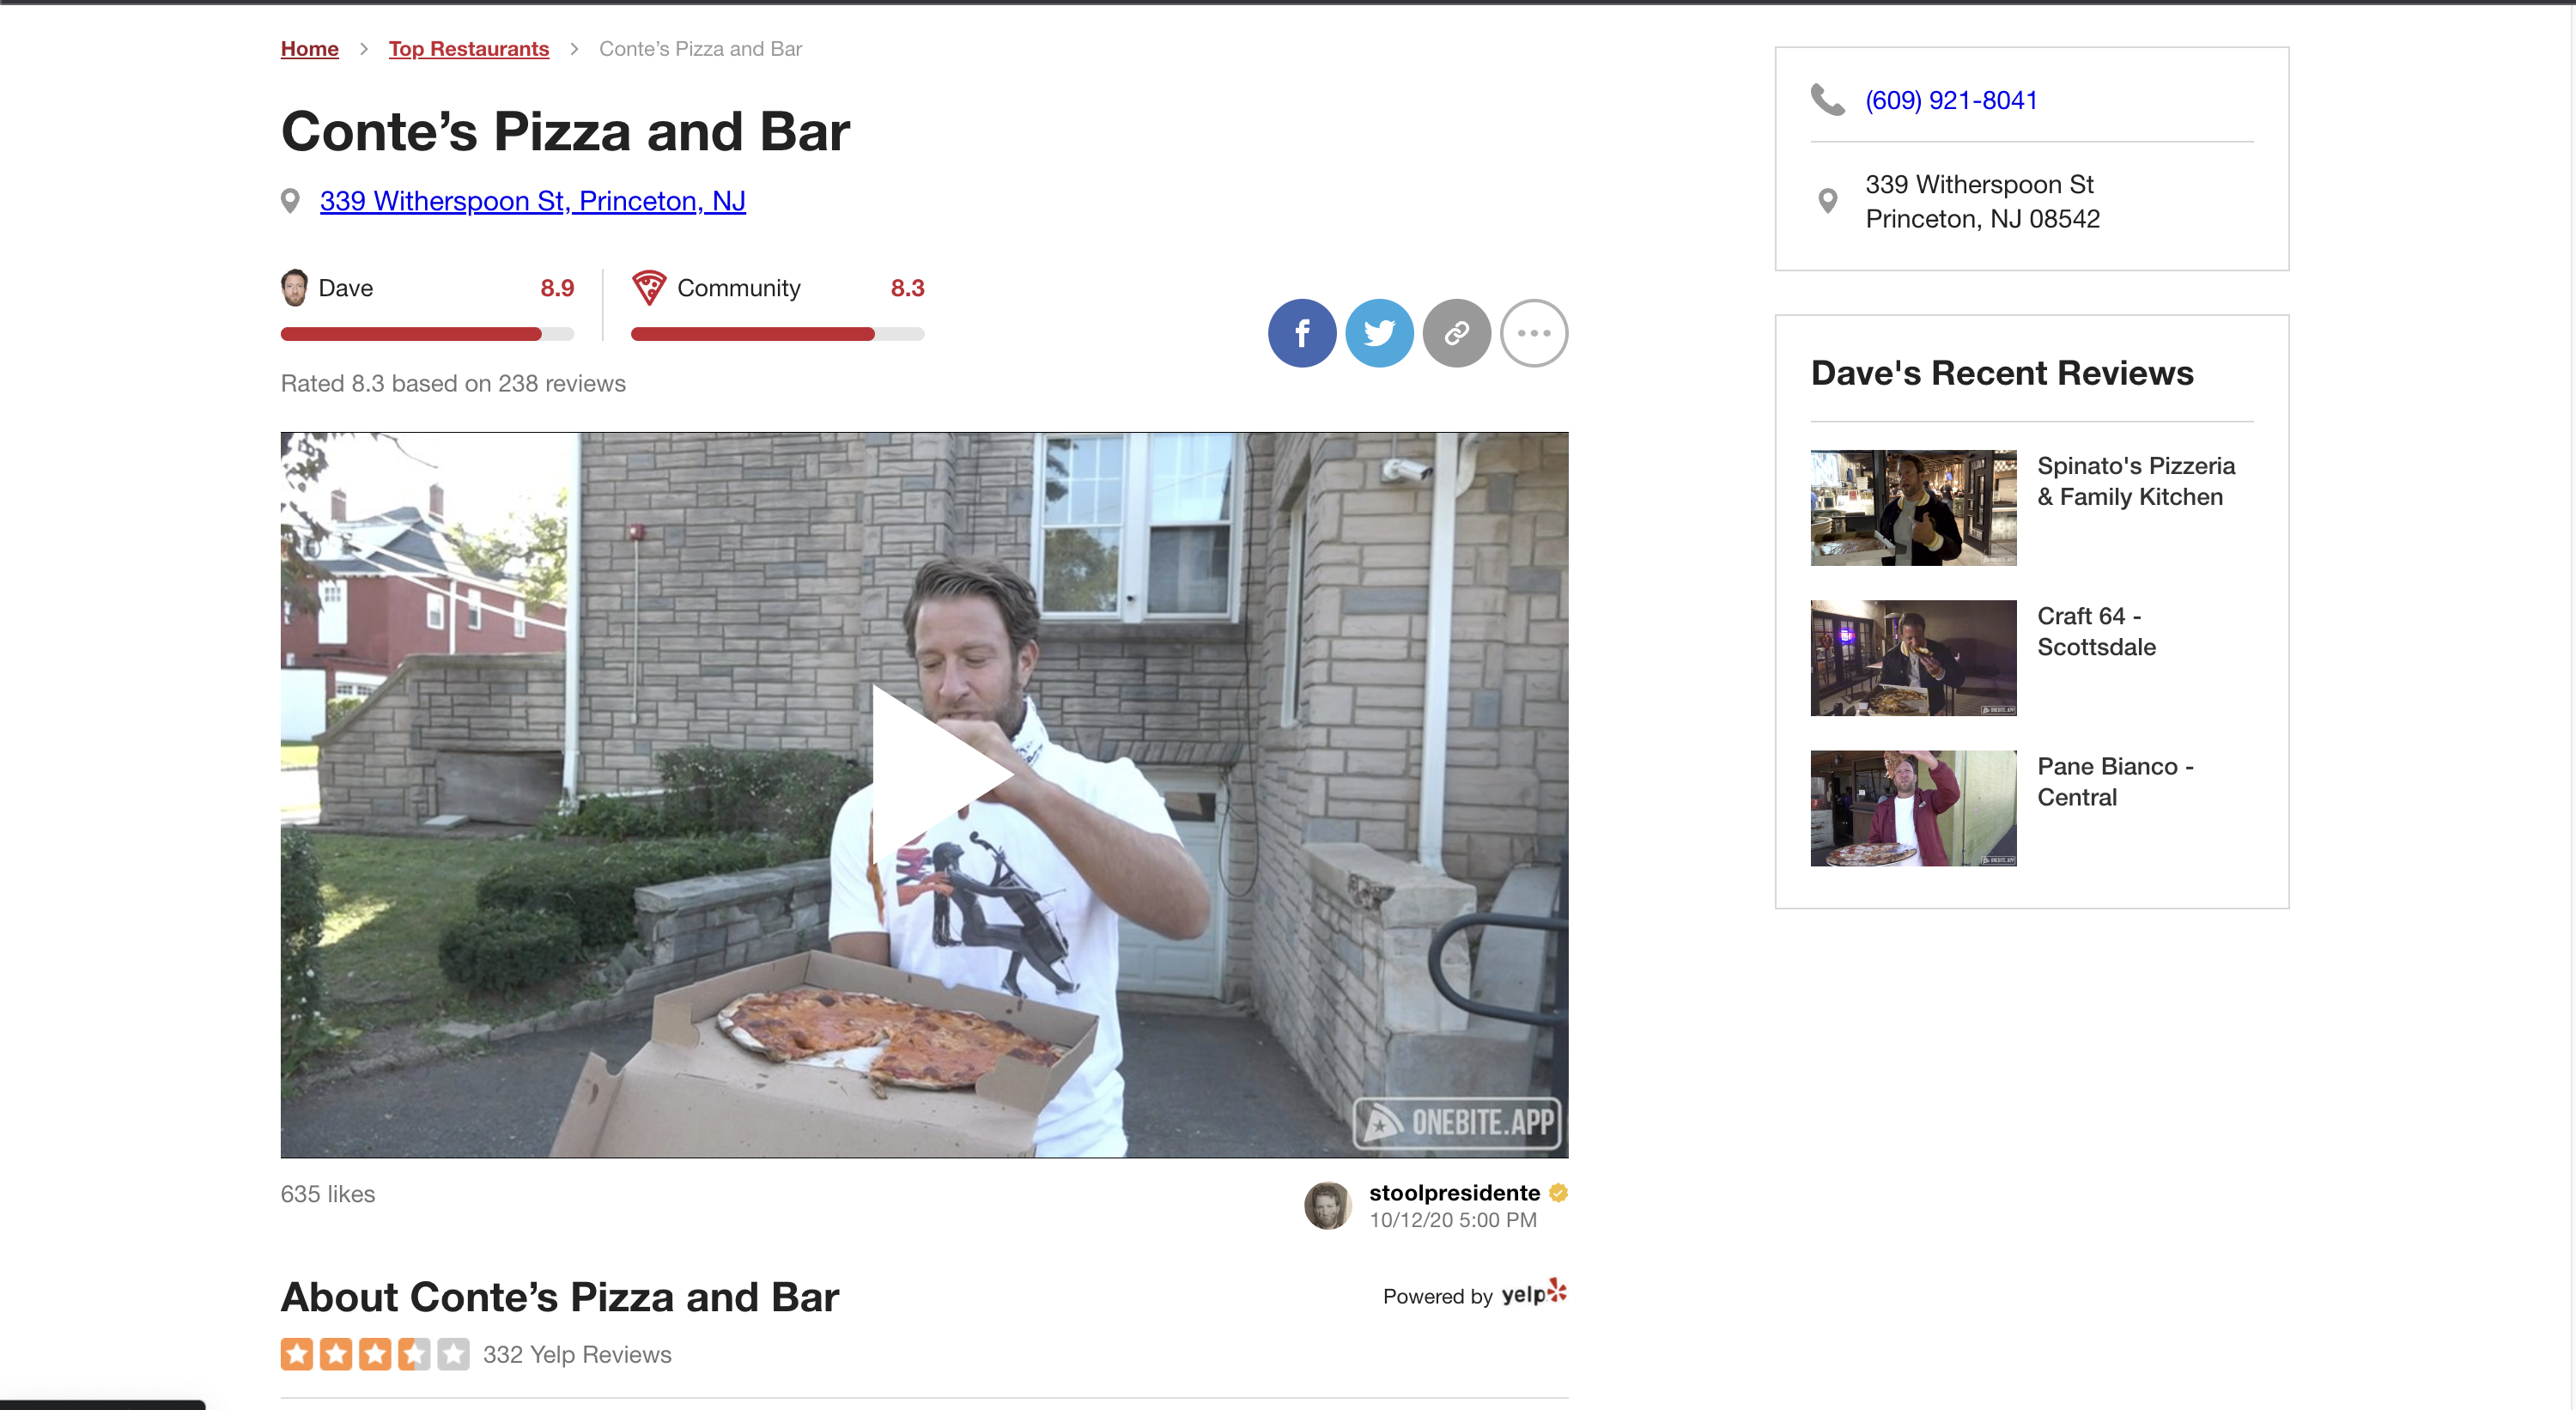
Here’s a breakdown of some of the data points gathered from the 1400+ links within the One Bite website:
restaurant: The name of the restaurant.city: The city where the restaurant is locatedstate: The state where the restaurant is located.date: The date representing the date of the review.dave_score: The score given by Dave himself.fan_score: The average score given by all the users who reviewed that particular restaurant.onebite_reviews: The number of reviews on the One Bite app.yelp_stars: The average star rating of the restaurant on Yelp.yelp_reviews: The number of reviews on Yelp.latitude & longitude: The coordinates of the restaurant
Here are the data points gathered from the One Bite Youtube Page which is home to most of the video reviews from Dave.
titleview_countlike_countcomment_countpublisheddurationvideo_id

With the data I collected, I conducted a thorough analysis of the One Bite Pizza Reviews. This included identifying the highest-rated pizza joints in the series, observing how Dave’s scores changed over time, and finding any links between Dave’s scores and other elements like Yelp ratings and fan scores.
Consistency Link to heading
Let’s first look at the frequency of Dave’s reviews over the years.

From the chart, it’s clear that Dave began his pizza-tasting venture in 2013. However, it wasn’t until 2016 that he truly upped the ante, posting a total of 78 reviews that year. From that point forward, he has consistently produced approximately 200 reviews annually/

Looking closer at the dates, we can see that Dave has been pretty consistent with the frequency of his reviews posting about 20 reviews every month. The 3-month slowdown in reviews at the beginning of 2020 can be explained by the start of the COVID-19 pandemic. The highest reviewed year was in 2019 with him dishing out 250 reviews within 365 days! Chances of Dave reviewing your restaurant are greater in the latter half of the year with August and October being the highest reviewed months out of the year historically.
Scores Link to heading
Dave utilizes a unique scoring system based on a decimal scale of 0 to 10, where 10 signifies the epitome of pizza perfection. As we’ll soon discover, these scores have the potential to significantly impact a business.
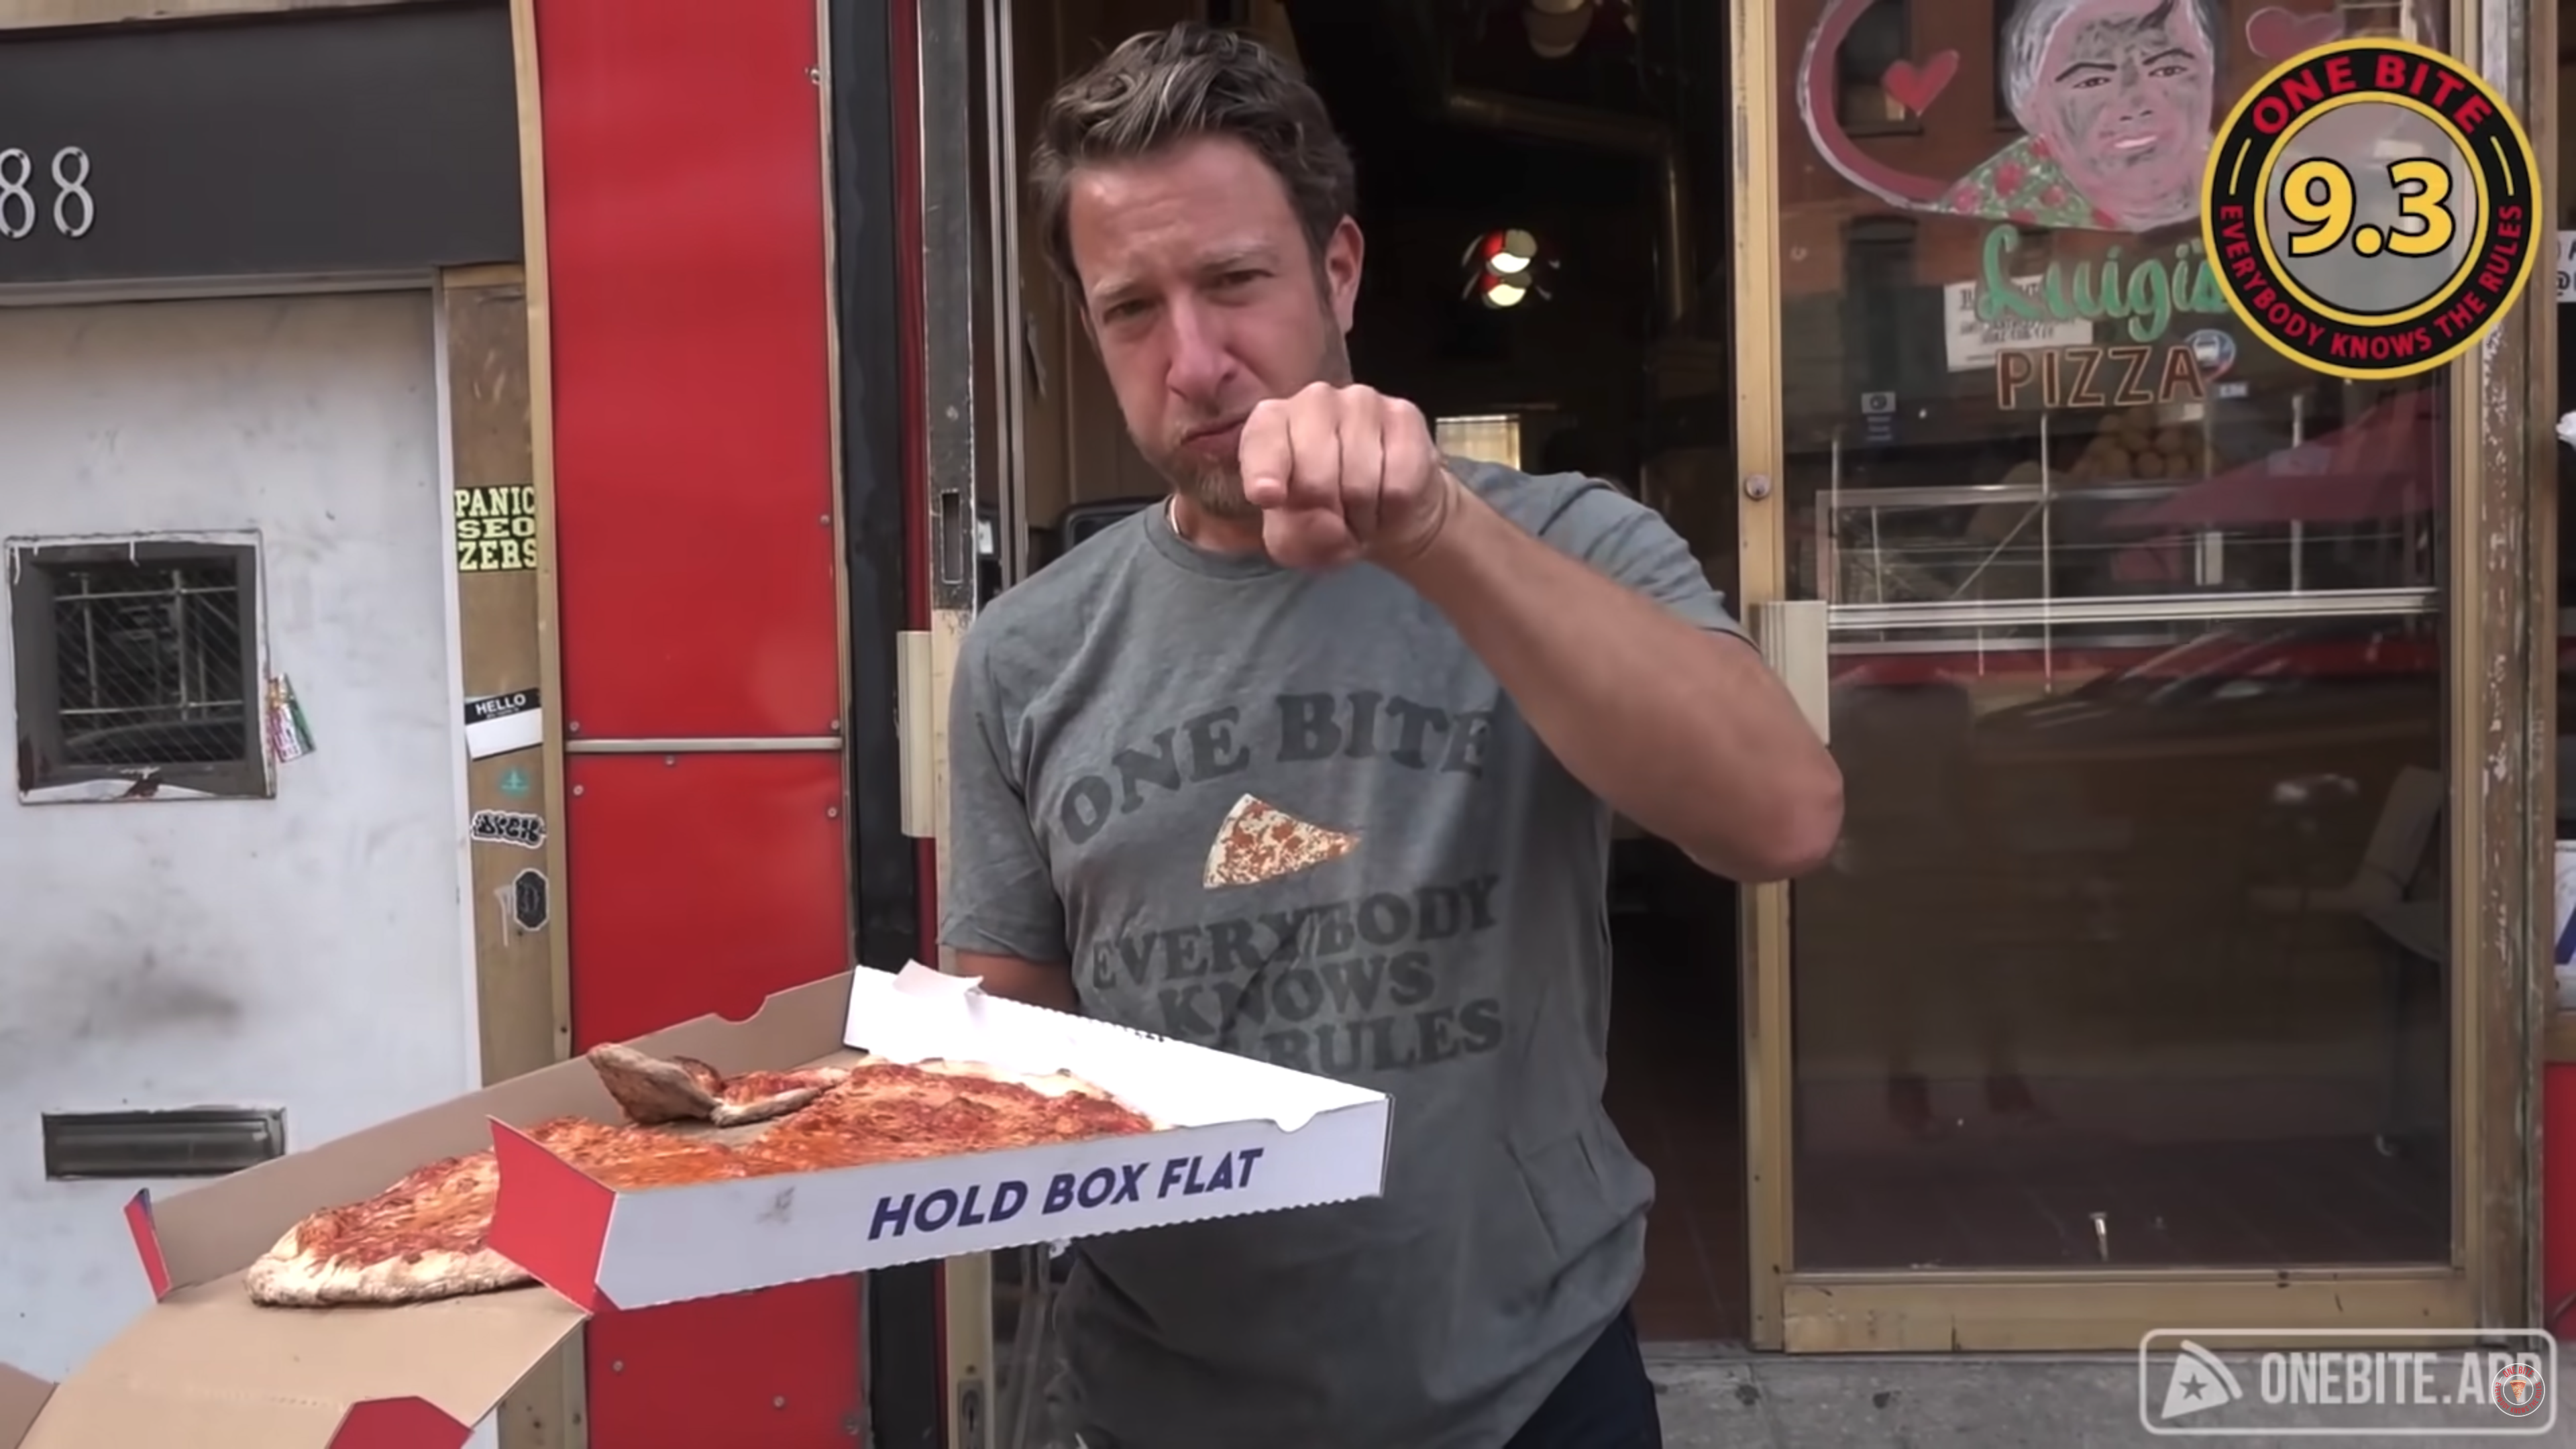
Contrary to what you might expect, a score of 0 isn’t reserved solely for the worst-tasting pizzas. There have been eight instances where Dave has awarded this lowest possible score, often due to an upsetting experience during the review process. For instance, Blaze Pizza received an immediate zero rating, not because of its taste, but due to Dave’s distaste for LeBron James’s association with the pizzeria. This sentiment was so strong that Dave even dropped the pizza box on the spot.
Despite the roughness of Dave’s scoring system, one establishment has managed to achieve the pinnacle of pizza rankings - a perfect 10. That honor goes to Monte’s Restaurant located in Massachusetts.

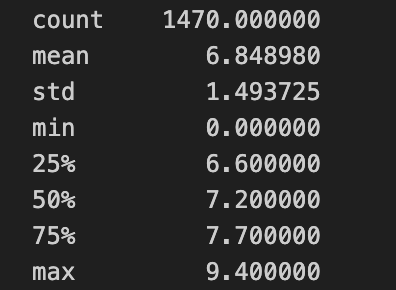
Examining the distribution of Dave’s scores reveals an average rating of 6.8, with a standard deviation of 1.49. The consistency in these scores suggests that Dave employs a stable rating system. Interestingly, it appears that the distinction between a good pizza and an excellent one is rather subtle, according to Dave’s evaluations. On the other hand, a pizza must significantly miss the mark to be classified as ‘bad’, indicating that a multitude of factors need to go awry for a pizza to earn a low score.
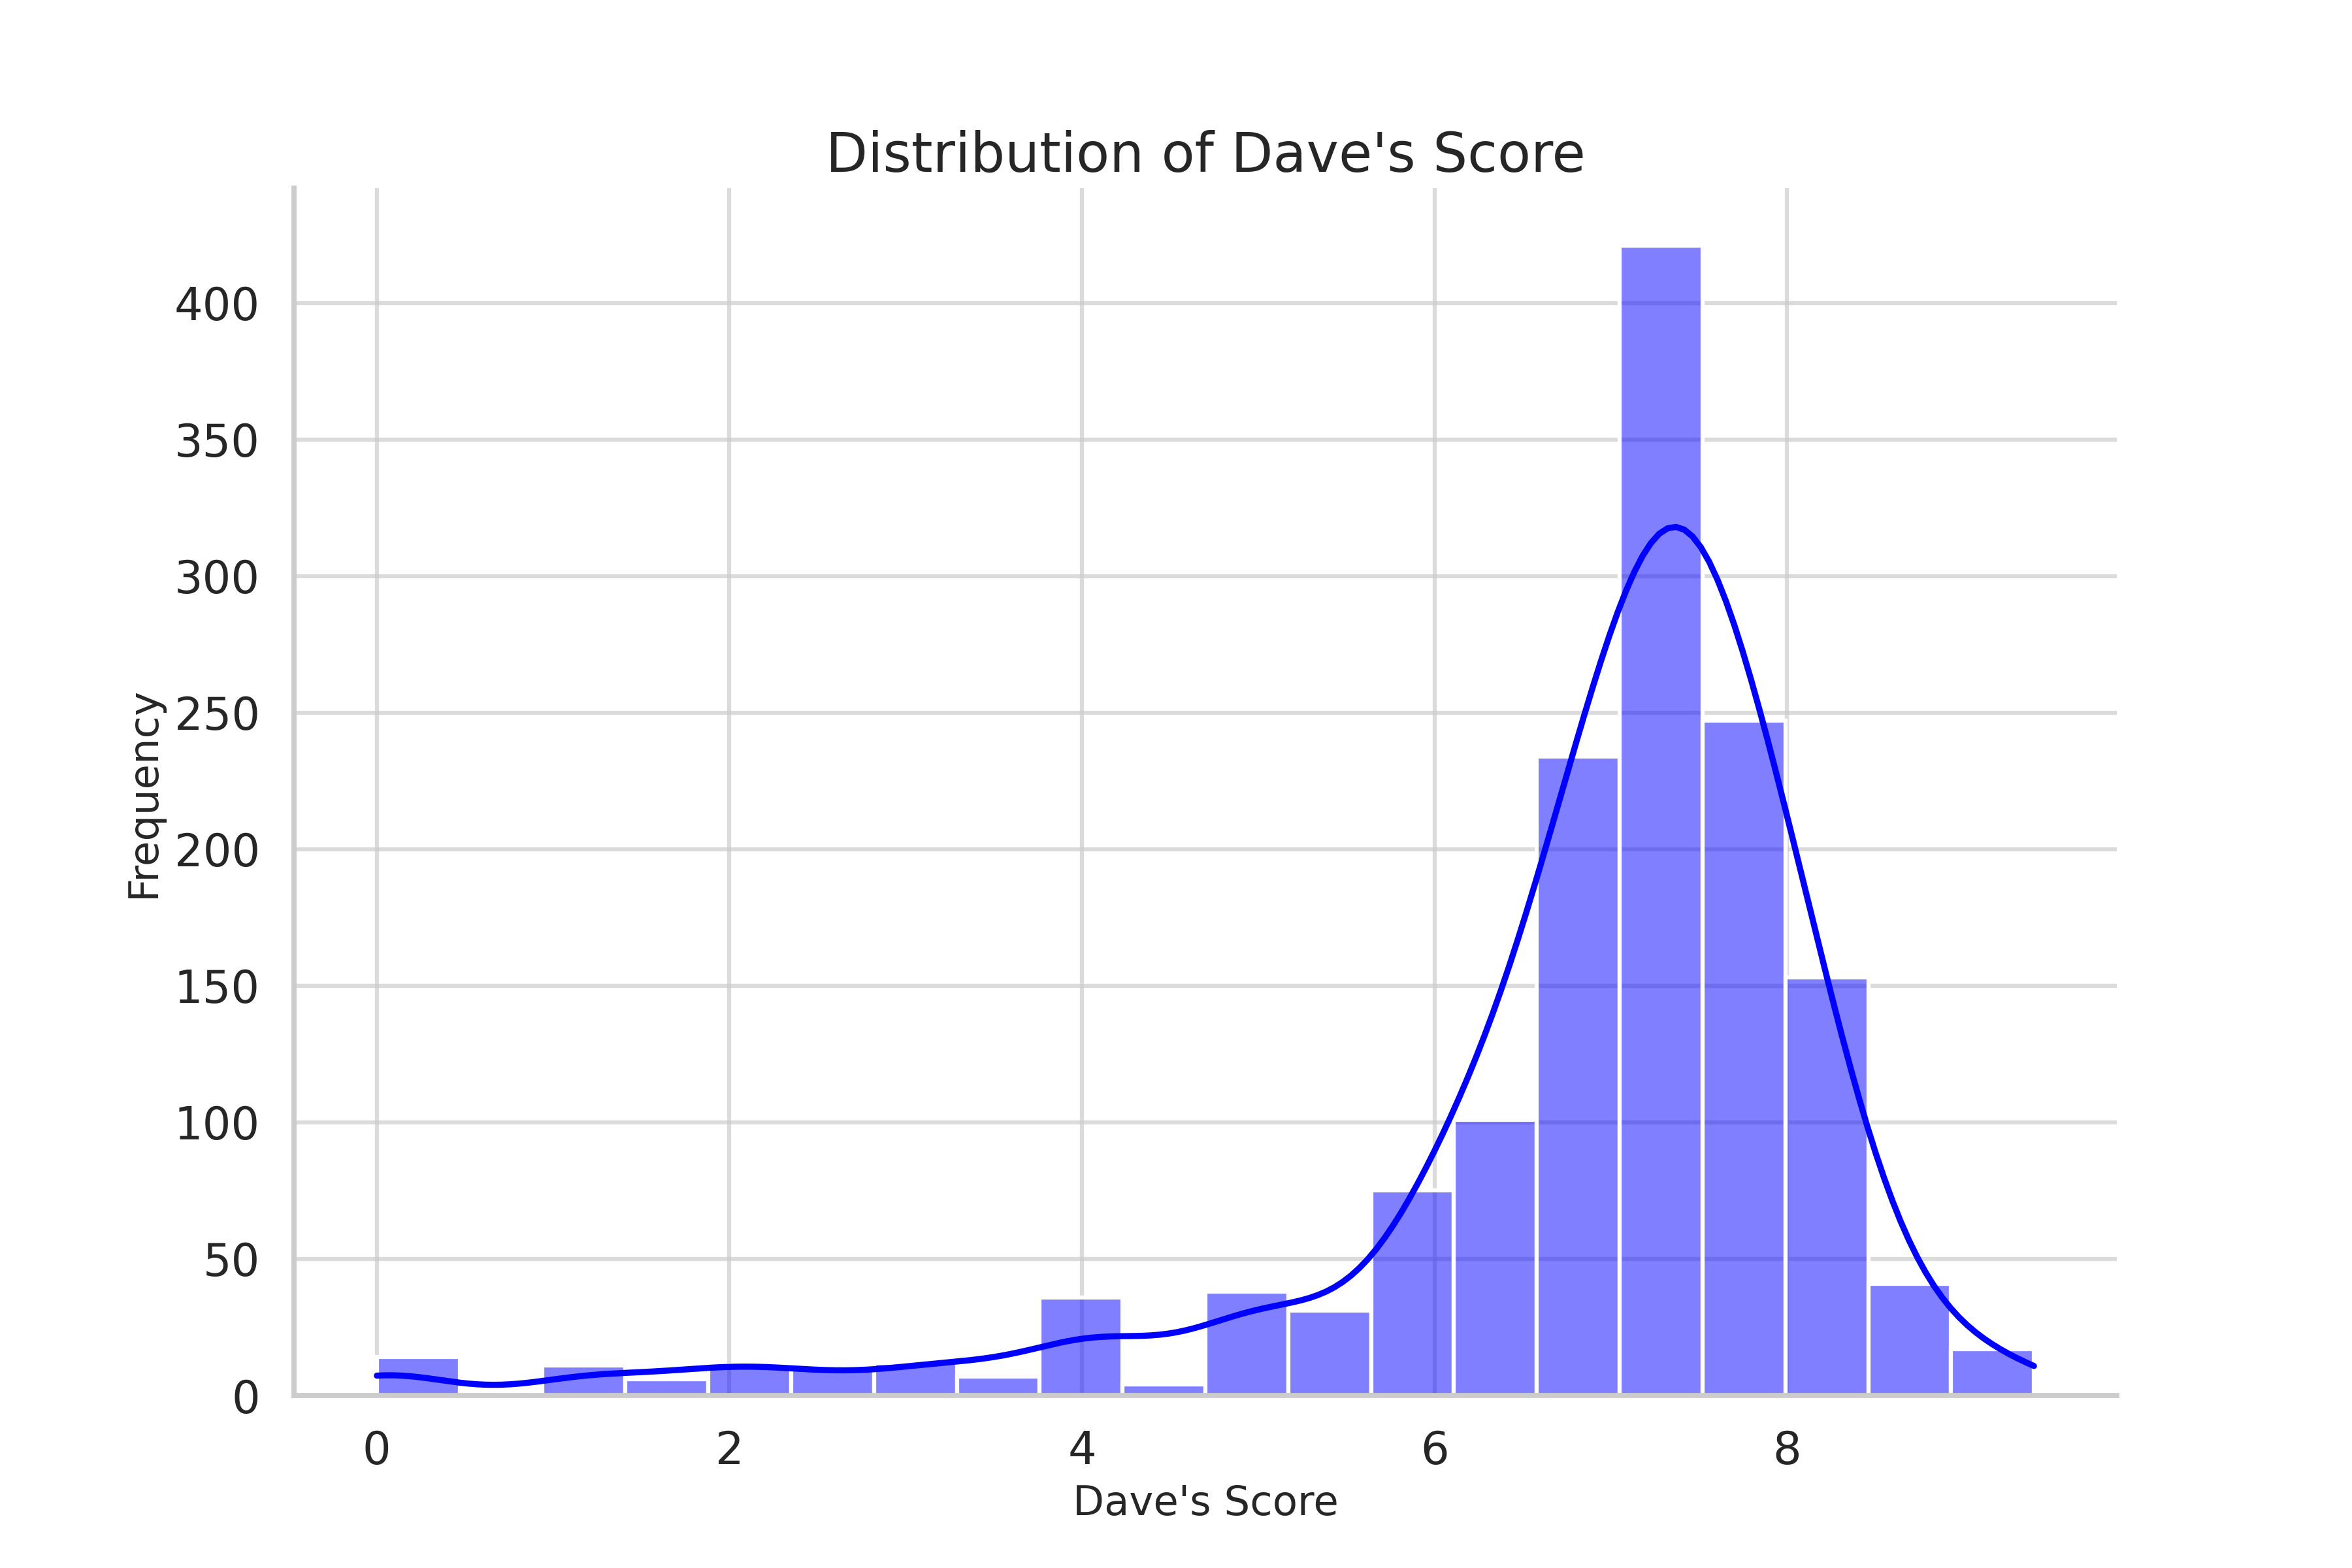
Examining Dave’s Scores further, it can be seen that the scores are fairly consistent month over month, with minor fluctuations. Notably, an upward trend in ratings is observed from the year 2020 onwards, adding a subtle layer of complexity to this monthly overview. The highest average score appears in June, a rating of 7.19, closely followed by February and July, with respective scores of 7.14 and 7.1.

Interestingly, the distribution of user scores mirrors Dave’s quite closely. This suggests a general agreement between Dave’s assessments and those of the viewers. However, Dave’s scoring trend tends to favor slightly higher ratings, with the average user score falling to 6.98. This could indicate that Dave is often more generous in his evaluations, or it might be that the users are a bit more critical in their judgments.
On the other hand, fan scores exhibit more diversity. A standard deviation of 1.76 implies a greater range of scores among fans, suggesting more variability in their evaluations. This higher standard deviation indicates that the fans’ opinions vary more widely, possibly due to personal tastes and preferences.
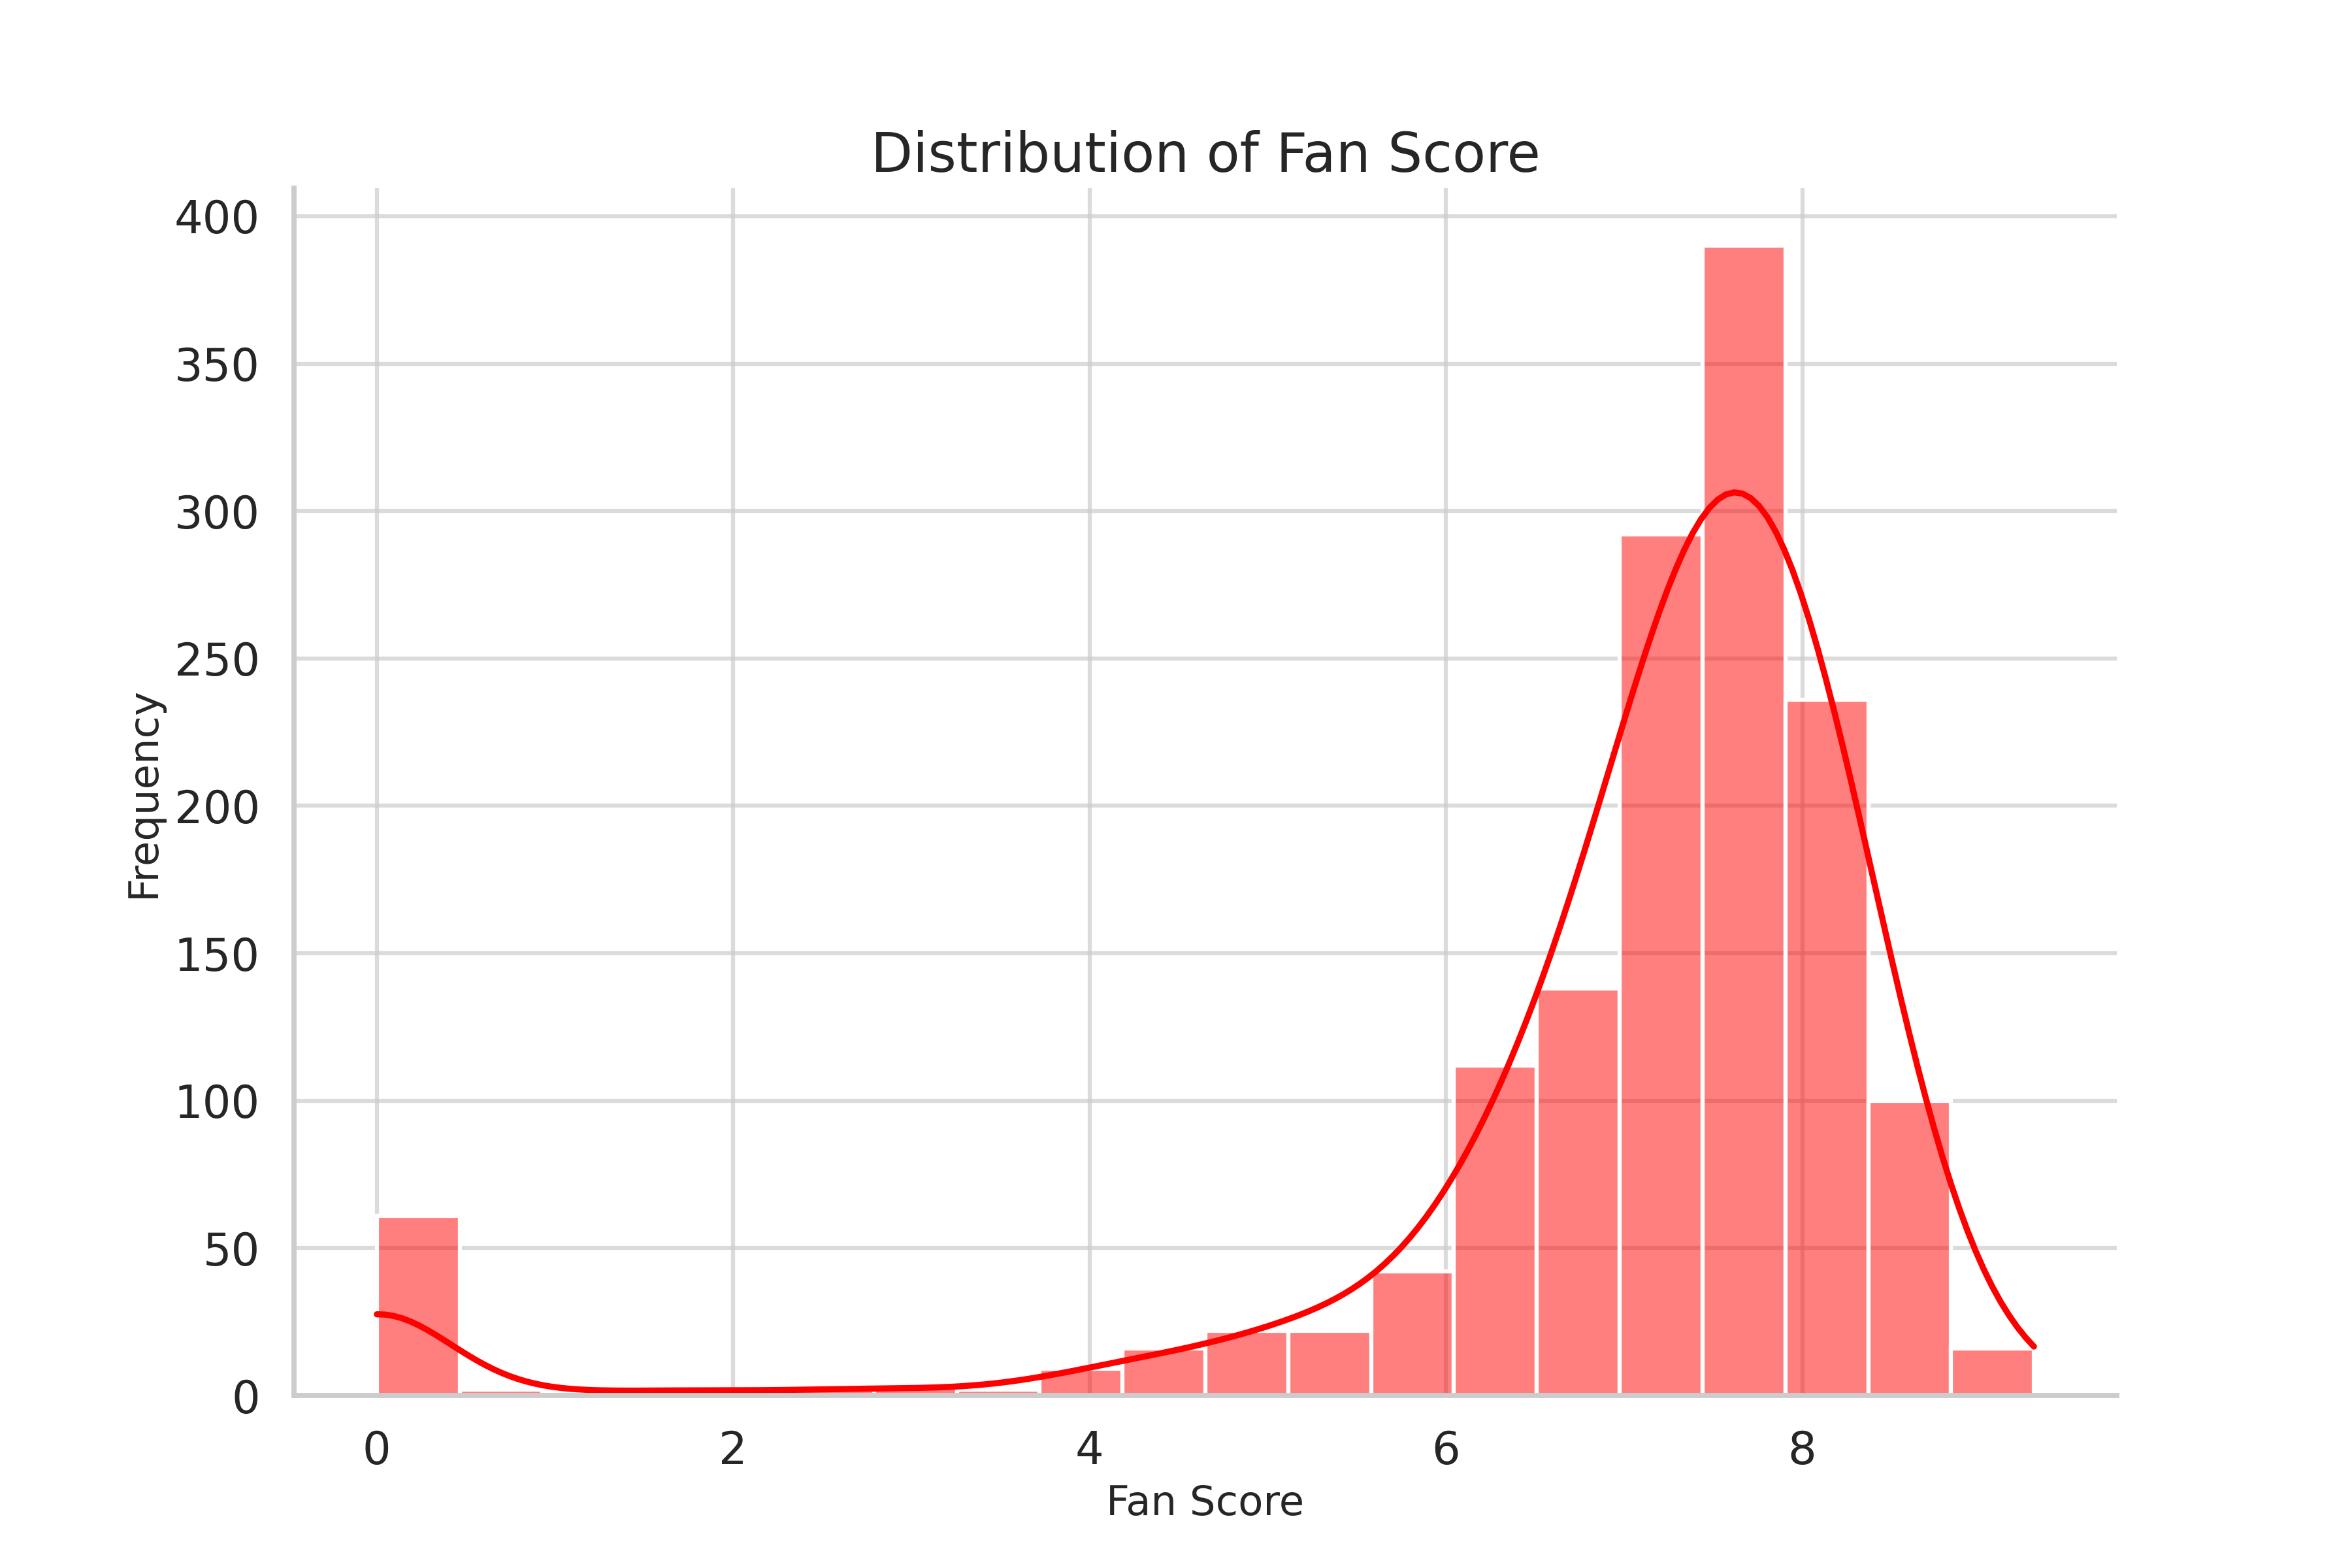
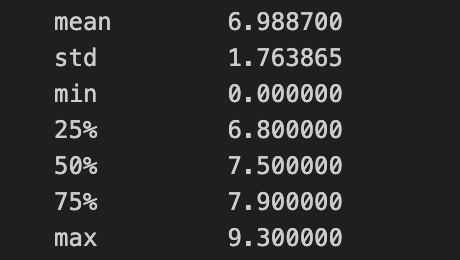
Overall, the data indicates that while Dave’s ratings and those of the fans follow a similar pattern, fans are usually a bit more liberal with their scores, reflecting a broader range of ratings. This implies that Dave’s expert taste in pizza aligns well with what the general public thinks, proving the reliability of his ratings.

While collecting data, I discovered that each page contained Yelp review data. I decided to include this in my analysis, which led to the creation of one of my favorite graphs for this project. This graph offers a comparative view of Yelp stars and Fan scores, with the color coding reflecting Dave’s scores for each restaurant. Each plot point represents an individual restaurant.

The distribution of Yelp stars creates an interesting clustering effect, with the gradient of Dave’s scores visible within these clusters. The highest scores, depicted in yellow, are situated at the top of each cluster. Interestingly, despite some restaurants receiving low scores from Dave, they still managed to land in the high 4.5-star range on Yelp. This dynamic representation of data offers valuable insights into the correlation and differences between Yelp stars, Fan scores, and Dave’s ratings.
Location Link to heading
Embarking on a global culinary journey, Dave has indulged in a multitude of pizzas from various eateries around the globe. His quest for the ultimate slice has led him to countries renowned for their culinary culture, including Italy, the birthplace of pizza, France, known for its gastronomic finesse, and England, with its own unique take on this beloved dish.
Leveraging the Google Maps API, I was able to extract the geographical coordinates of each restaurant Dave has critiqued since the inception of his pizza review journey. This rich dataset provides an intriguing geographic dimension to Dave’s pizza adventures.

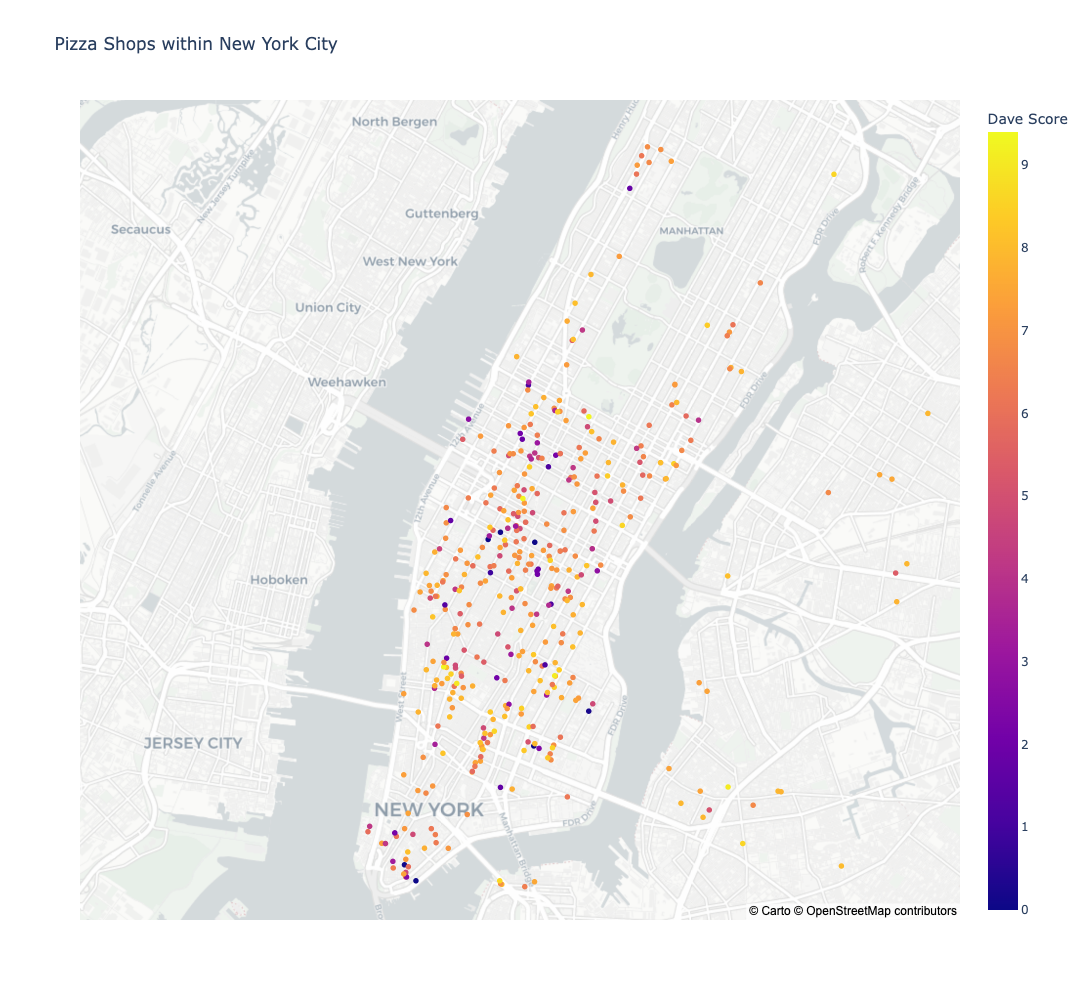
The bulk of Dave’s reviews are concentrated in New York (600+), particularly in the diverse culinary landscape of New York City. Other states like New Jersey and Florida also feature prominently in his review portfolio.


What’s intriguing is the geographical distribution of Dave’s reviews within New York City. The reviews unveil clusters of pizza restaurants, some boasting higher average scores than others. It’s also fascinating to note the close proximity of these establishments to one another, a testament to the city’s dense culinary landscape. This exploration of Dave’s review path adds a compelling spatial dimension to his pursuit of pizza excellence.

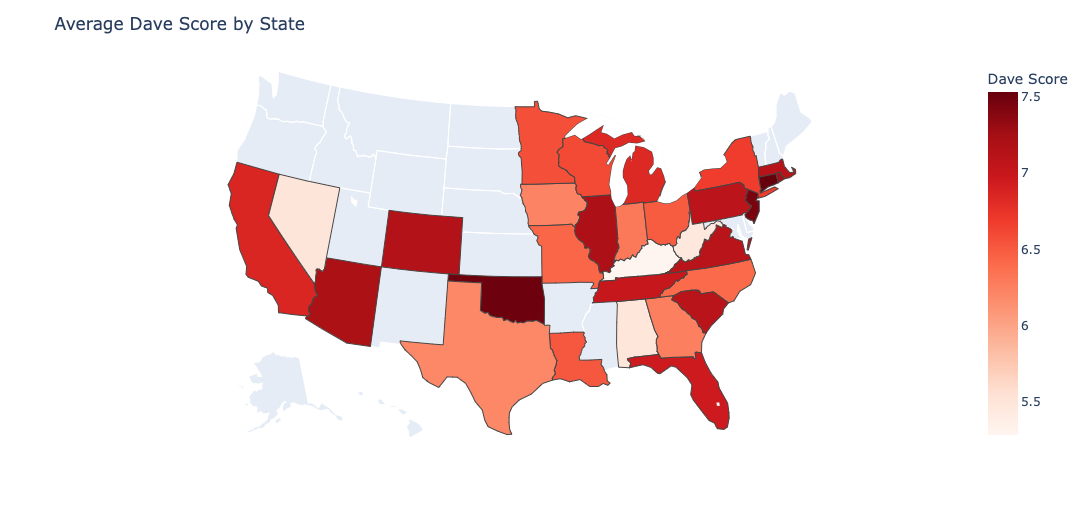
Remarkably, New York does not clinch the number one position in Dave’s Pizza ratings. That honor surprisingly goes to Connecticut. Dave harbors a special appreciation for the iconic New Haven-style slice, characterized by its ultra-thin crust baked in a wood-fired, brick oven. Adding to Connecticut’s accolades is its impressive average score of 7.48, standing as the highest among all states Dave has reviewed.
Youtube Link to heading
The influence of Dave Portnoy’s pizza reviews is immense and multifaceted. On one hand, he has been on a noble mission to travel and explore pizza restaurants far and wide, bringing visibility and public attention to both renowned and lesser-known pizzerias. But just how significant is his impact? A quick look at the statistics offers some insight. The One Bite Pizza Reviews on YouTube has amassed an astounding 450,000,000 views, with the average video racking up around 280,000 views. And this figure doesn’t even account for the visibility his reviews garner on other social media platforms like Twitter, Instagram, and TikTok.
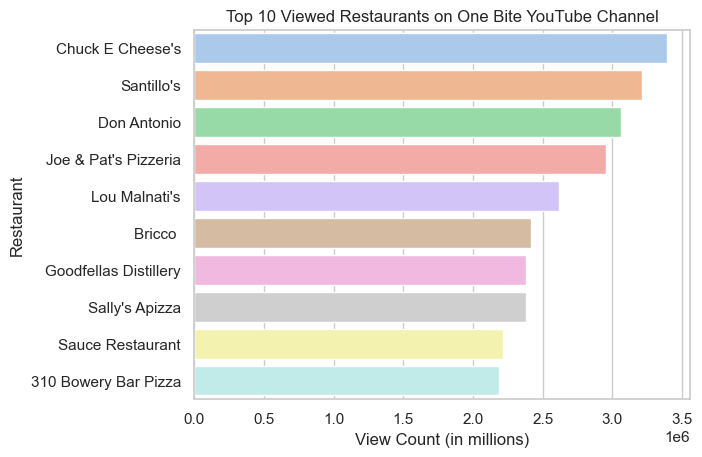
However, the relationship between views and Dave’s scoring isn’t straightforward. It isn’t the high-rated pizzas that necessarily rack up the most views, but rather the entertainment value of the review itself. The series is not only about the pizzas but also about the unique and often hilarious interactions and events that occur during the reviews. These memorable moments, like unexpected encounters with passersby or Dave’s candid reactions, add a viral dimension to the reviews. For instance, the most viewed video in the series is not a review of a gourmet, high-end pizza place, but a review of Chuck E. Cheese’s pizza, which has garnered over 3.5 million views.
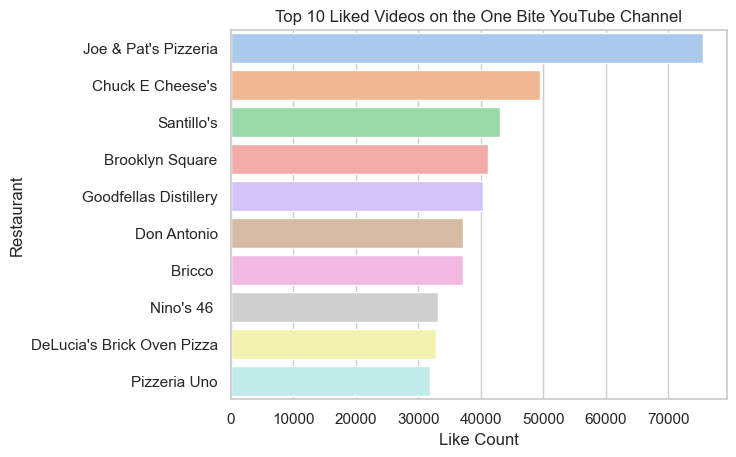
Yet, it’s worth noting that when Dave gives a high score, it can trigger an avalanche of attention for the reviewed establishment. Numerous articles and anecdotes highlight instances when Dave awarded a pizza joint an 8 or 9, causing the restaurant to explode in popularity virtually overnight. In one memorable case, a restaurant that received a score of 8.6 experienced such a surge in customers that lines stretched out the door. The sudden increase in popularity even necessitated the hiring of additional employees to keep up with the demand.
Transcripts and Sentiment Analysis Link to heading
To get a deeper understanding of the content of the reviews, I decided to perform sentiment analysis on the transcripts of the videos. Using the same Youtube API, I was able to extract the transcripts of each video. This was a long process due to the rate limits Youtube has on their API. I was able to extract the transcripts of about 1,000 videos, which is a majority of the reviews listed on the One Bite channel publicly.
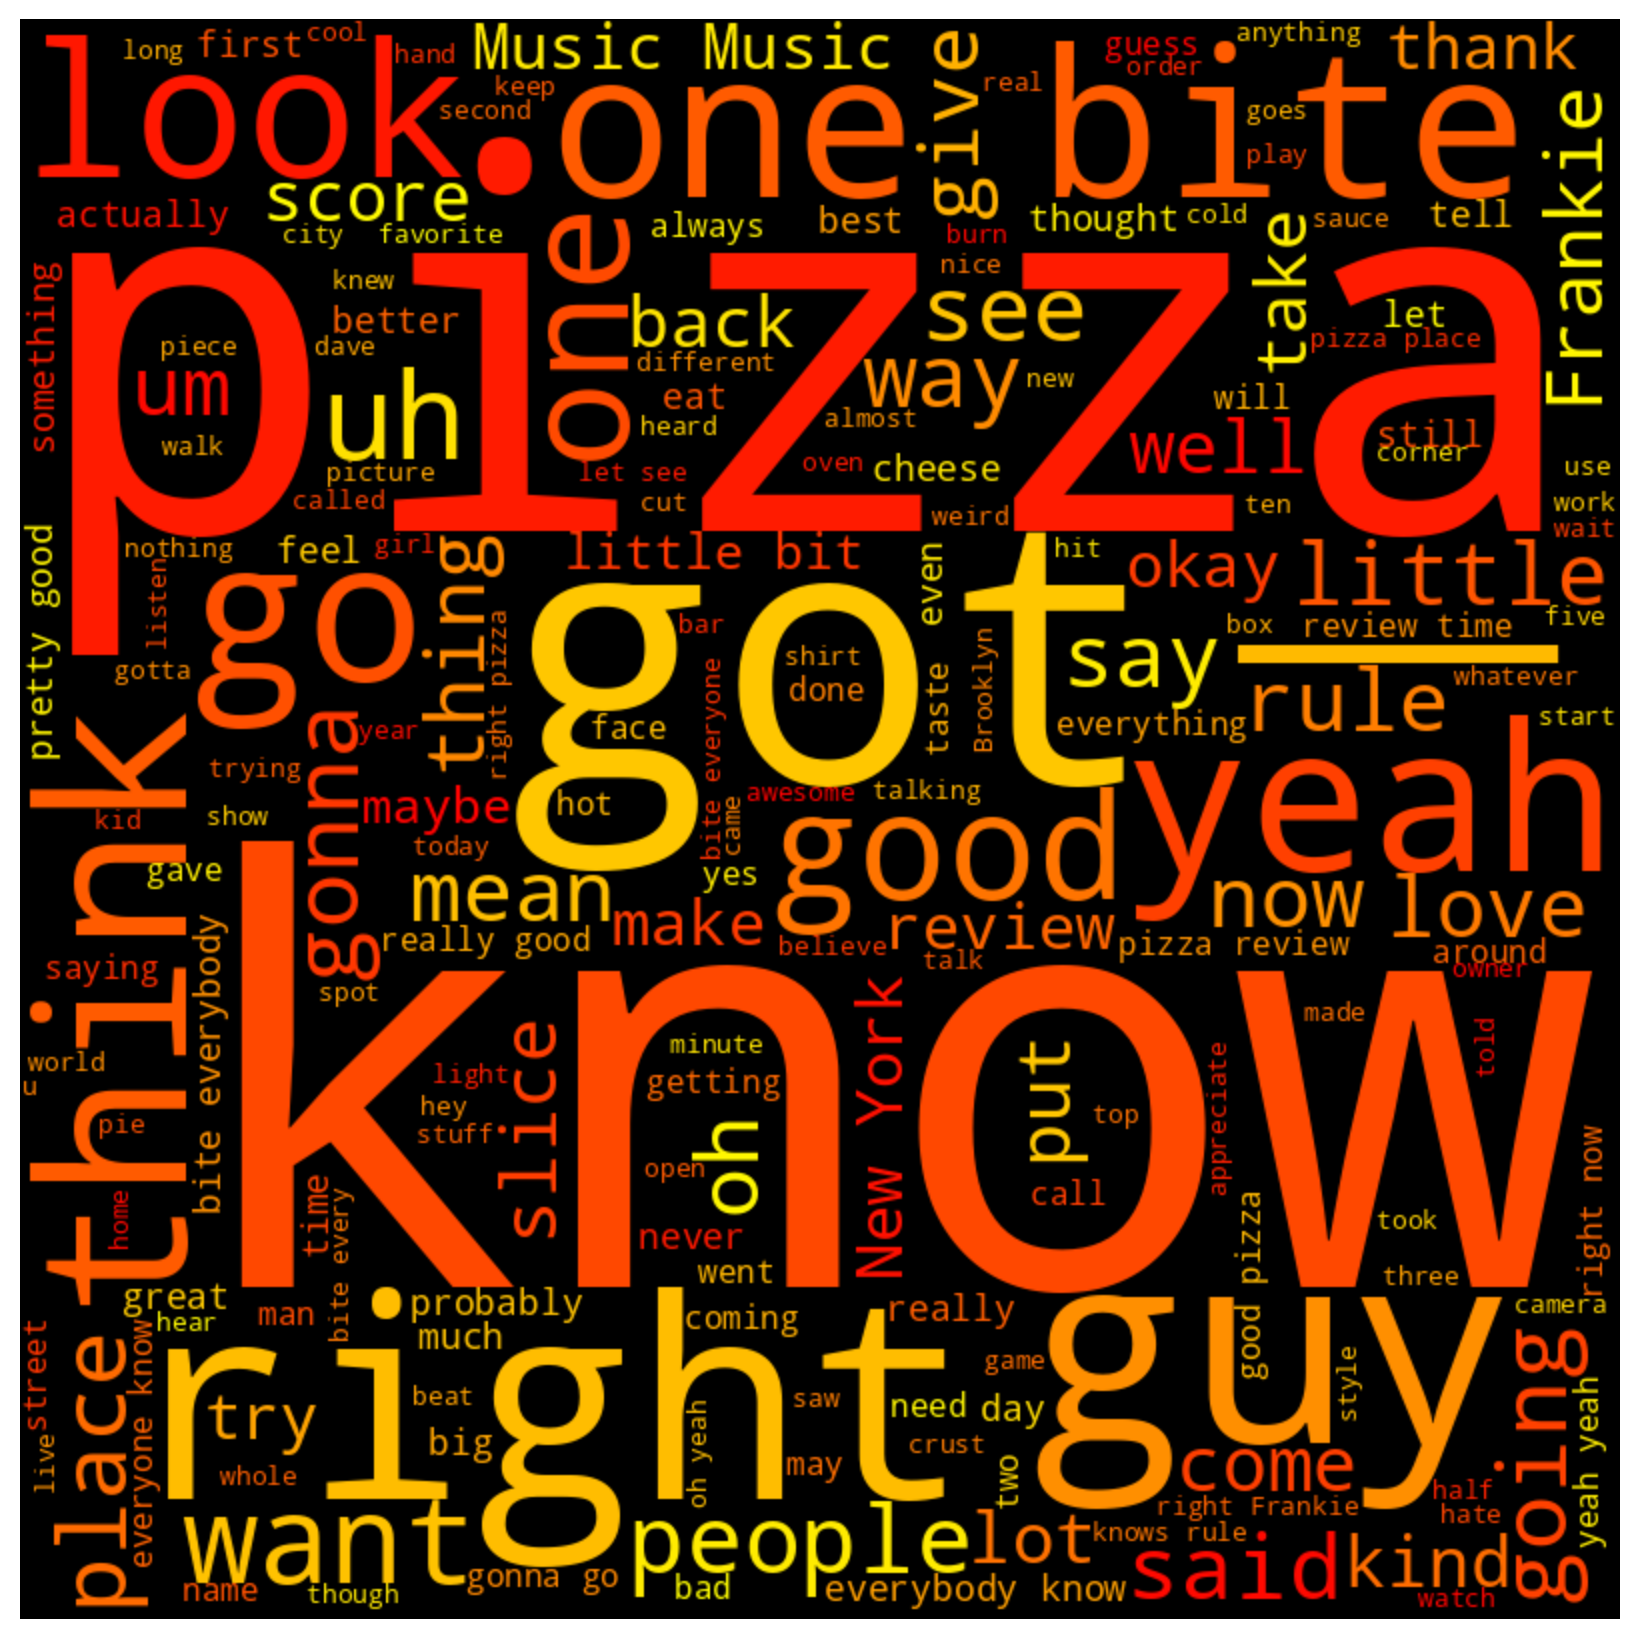
This word cloud provides a snapshot of the most common words in Portnoy’s reviews. The word “pizza,” the subject of every review, dominates the image, reflecting the central theme of his reviews. His signature catchphrase, “One Bite everybody knows the rules,” also features prominently, underscoring its recurring role in his review process. Other noticeable terms include “right” and “Frankie,” a reference to Dave’s cameraman who was behind the scenes in most of the reviews. The recurring phrase “alright Frankie” at the start of most reviews is hence captured. Notably, the word “good” stands out, reflecting Dave’s generally positive assessment of the pizzas he samples.
For sentiment analysis of each transcript, I employed TextBlob, a Python library for processing textual data. It provides a simple API for a host of common Natural Language Processing (NLP) tasks, including sentiment analysis. Sentiment scores in TextBlob are computed on a scale ranging from -1 to 1, where -1 represents a negative sentiment, 1 represents a positive sentiment, and 0 represents a neutral sentiment.

The plot illustrates that a significant number of reviews score around 0.2, signaling a neutral undertone in the majority of Dave’s videos. This observation aligns with Dave’s overall lighthearted and humorous reviewing style, which often carries a positive note.
With the distribution leaning slightly towards the positive side, the mean sentiment score comes out to be 0.34, and the median sentiment score rests at 0.23. The scarcity of negatively scored reviews could either signify a limitation of TextBlob’s sentiment analysis or mirror Dave’s generally optimistic stance across most reviews.
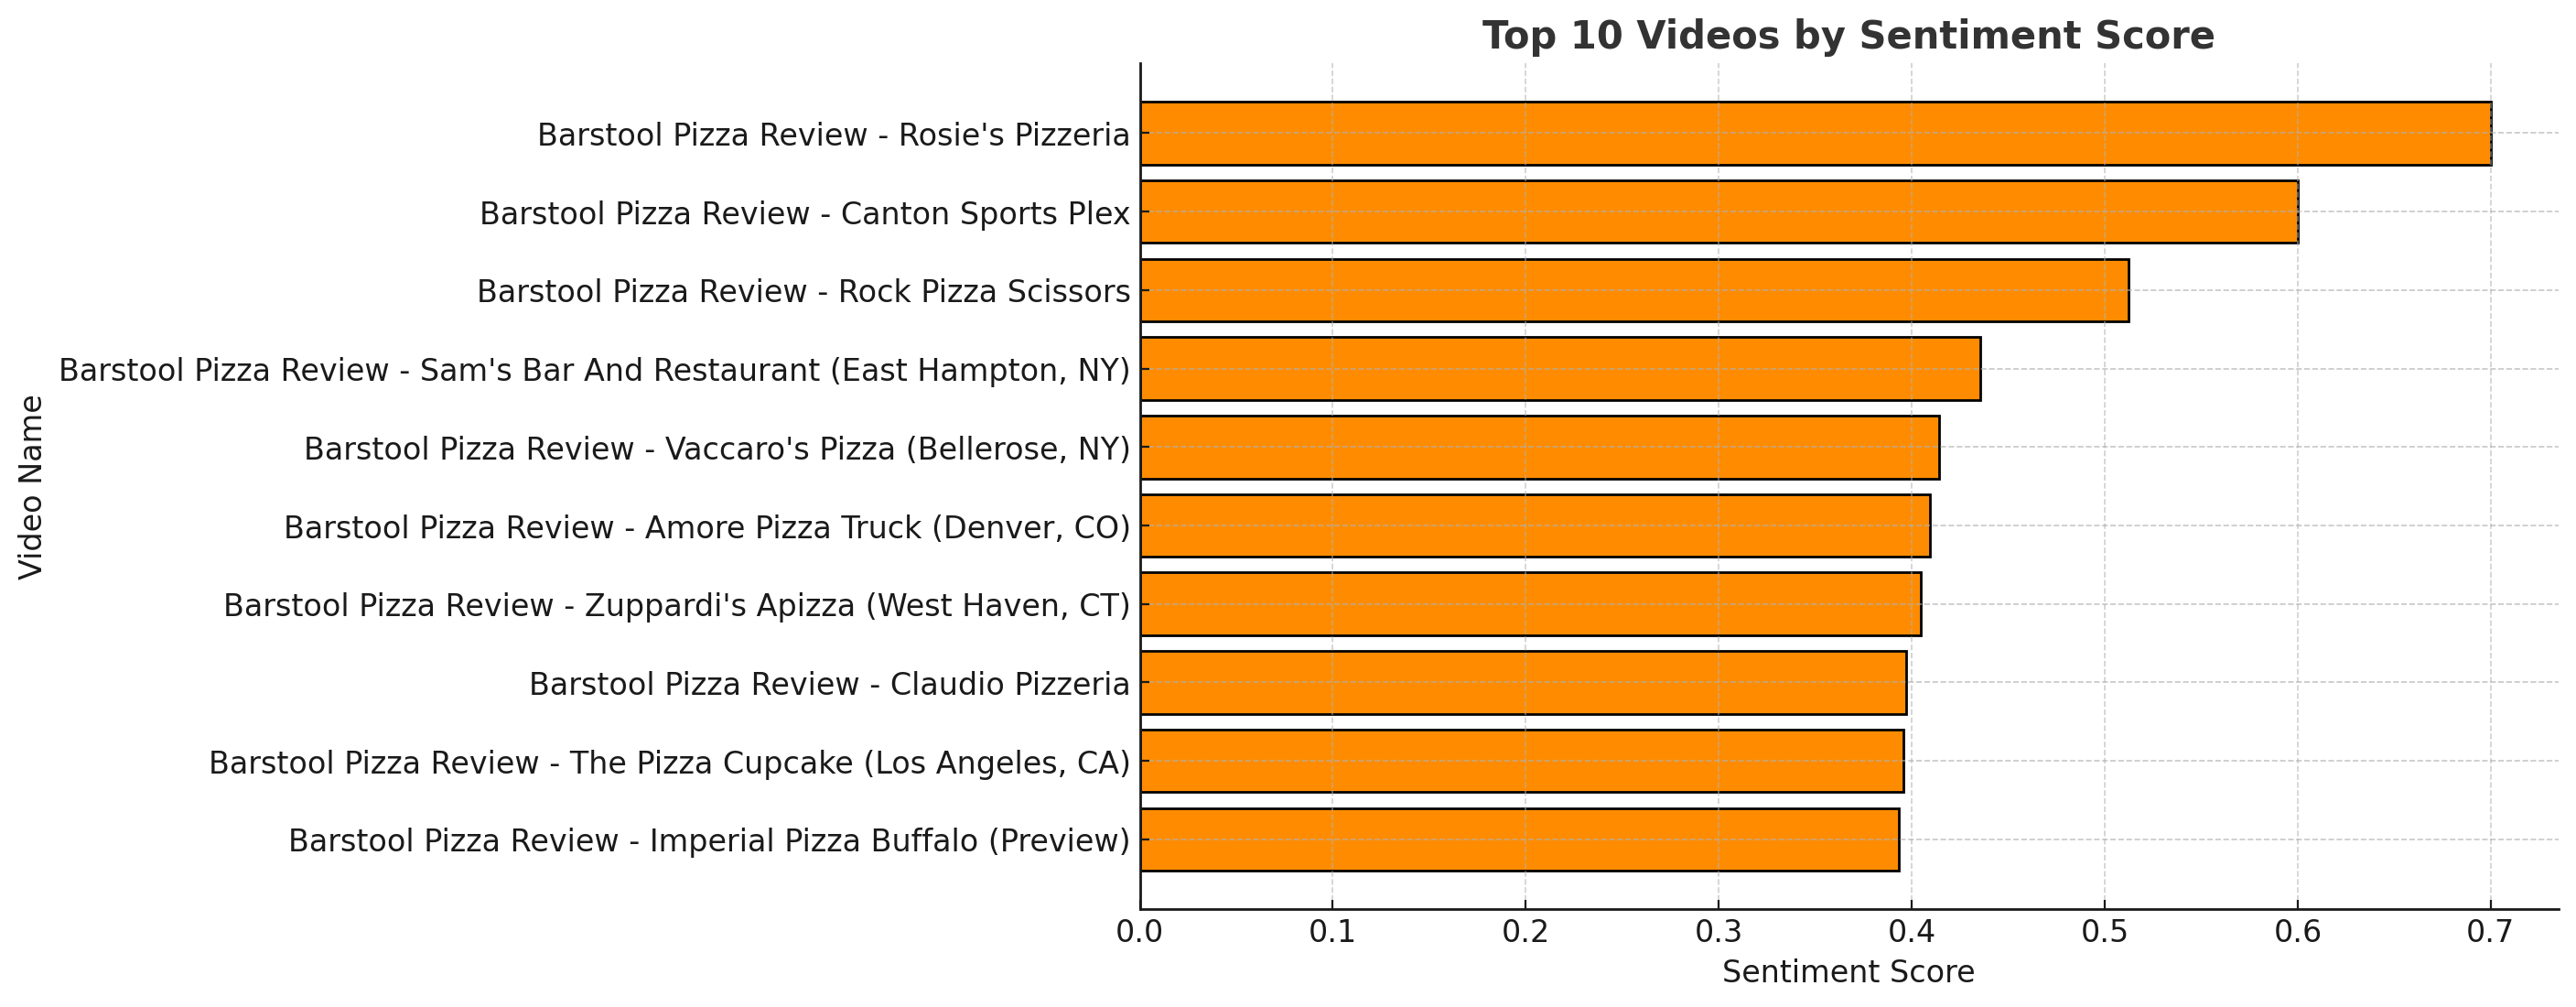
In further exploration, I further examined the distribution by segmenting the reviews with the top 10 highest sentiment scores. The review scoring the highest on the sentiment scale was the one for Rosie’s Pizzeria, which scored a .7. Remarkably, this review was one where Dave gave the pizza an 8.5, a notably high score by his standards.
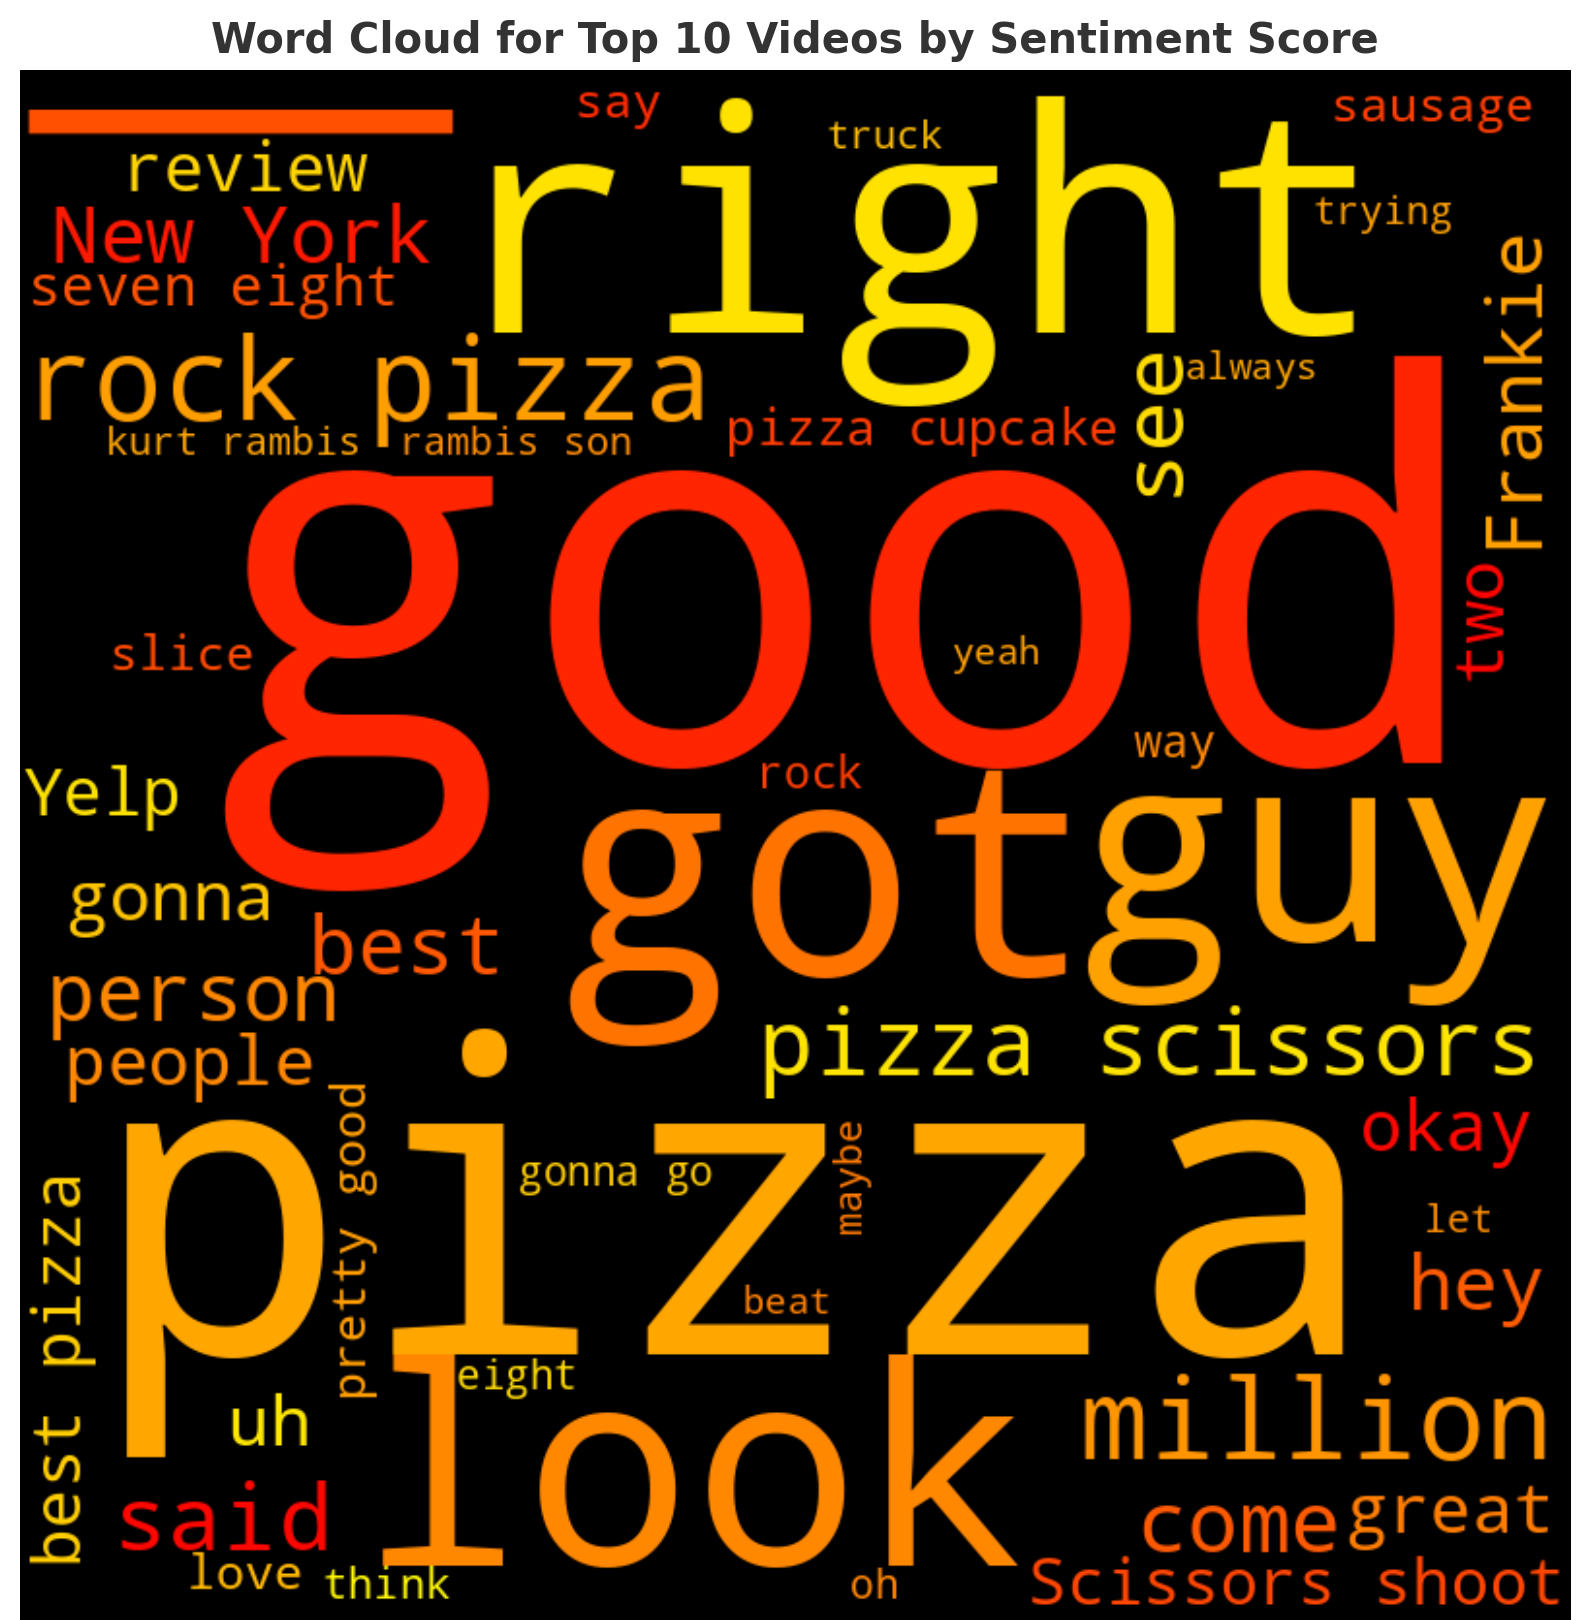
Looking at the wordcloud for the top-scoring videos, a lot of the words from the previous graph appear here. The dominating word ‘good’ is reflective of the favorable sentiment scores. Other positive terms such as ‘best,’ ‘great,’ ‘pretty good,’ and ’love’ are also prominently displayed. Their significant presence underlines the upbeat and positive language that helped push these particular reviews to the top of the sentiment scores.
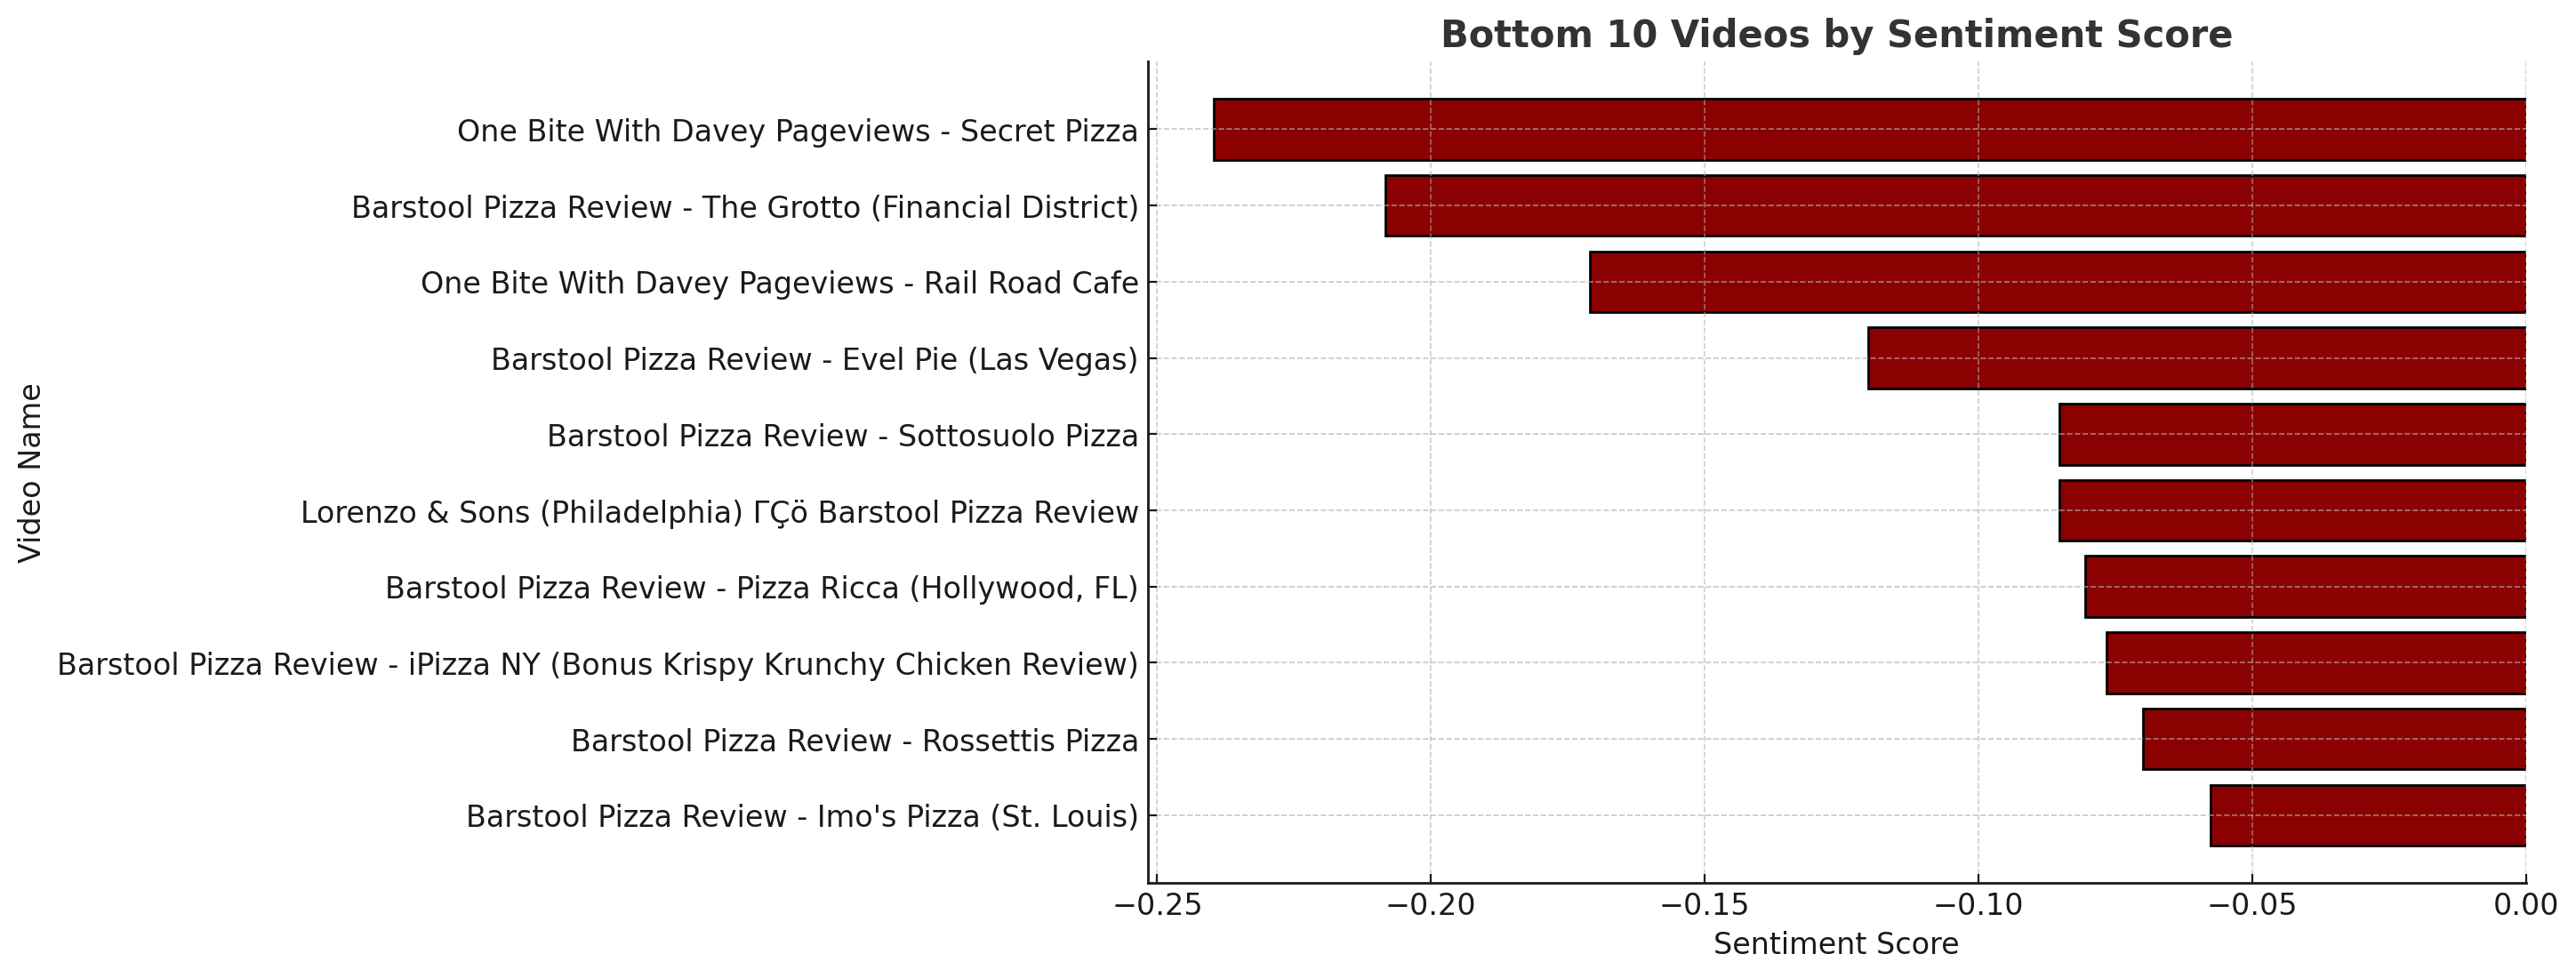
Analyzing the data on the lower end of the sentiment scale presents intriguing insights. The review for Secret Pizza had the lowest sentiment score of -.24. This corresponded with a low rating of 3.4 assigned by Dave, indicating an interesting relationship between sentiment scores and Dave’s own ratings. Following closely was The Grotto, with a sentiment score of -.21 and a respective Dave’s score of 3.3. This pattern reaffirms the connection between the sentiment scores and Dave’s ratings, especially apparent when considering lower-rated reviews.
Examining the Wordcloud of the lowest-scoring videos reveals a stark contrast to the positive language found in the top-scoring ones. Though some commonly used words persist, new and notably negative terms appear more frequently in this set. Words such as ‘cold,’ ‘bad,’ ‘hate,’ ’never,’ and ’little’ emerge as dominant in this landscape of language. These words, mostly carrying a negative connotation, play a significant role in driving the sentiment scores down in these particular reviews.

Rankings Link to heading
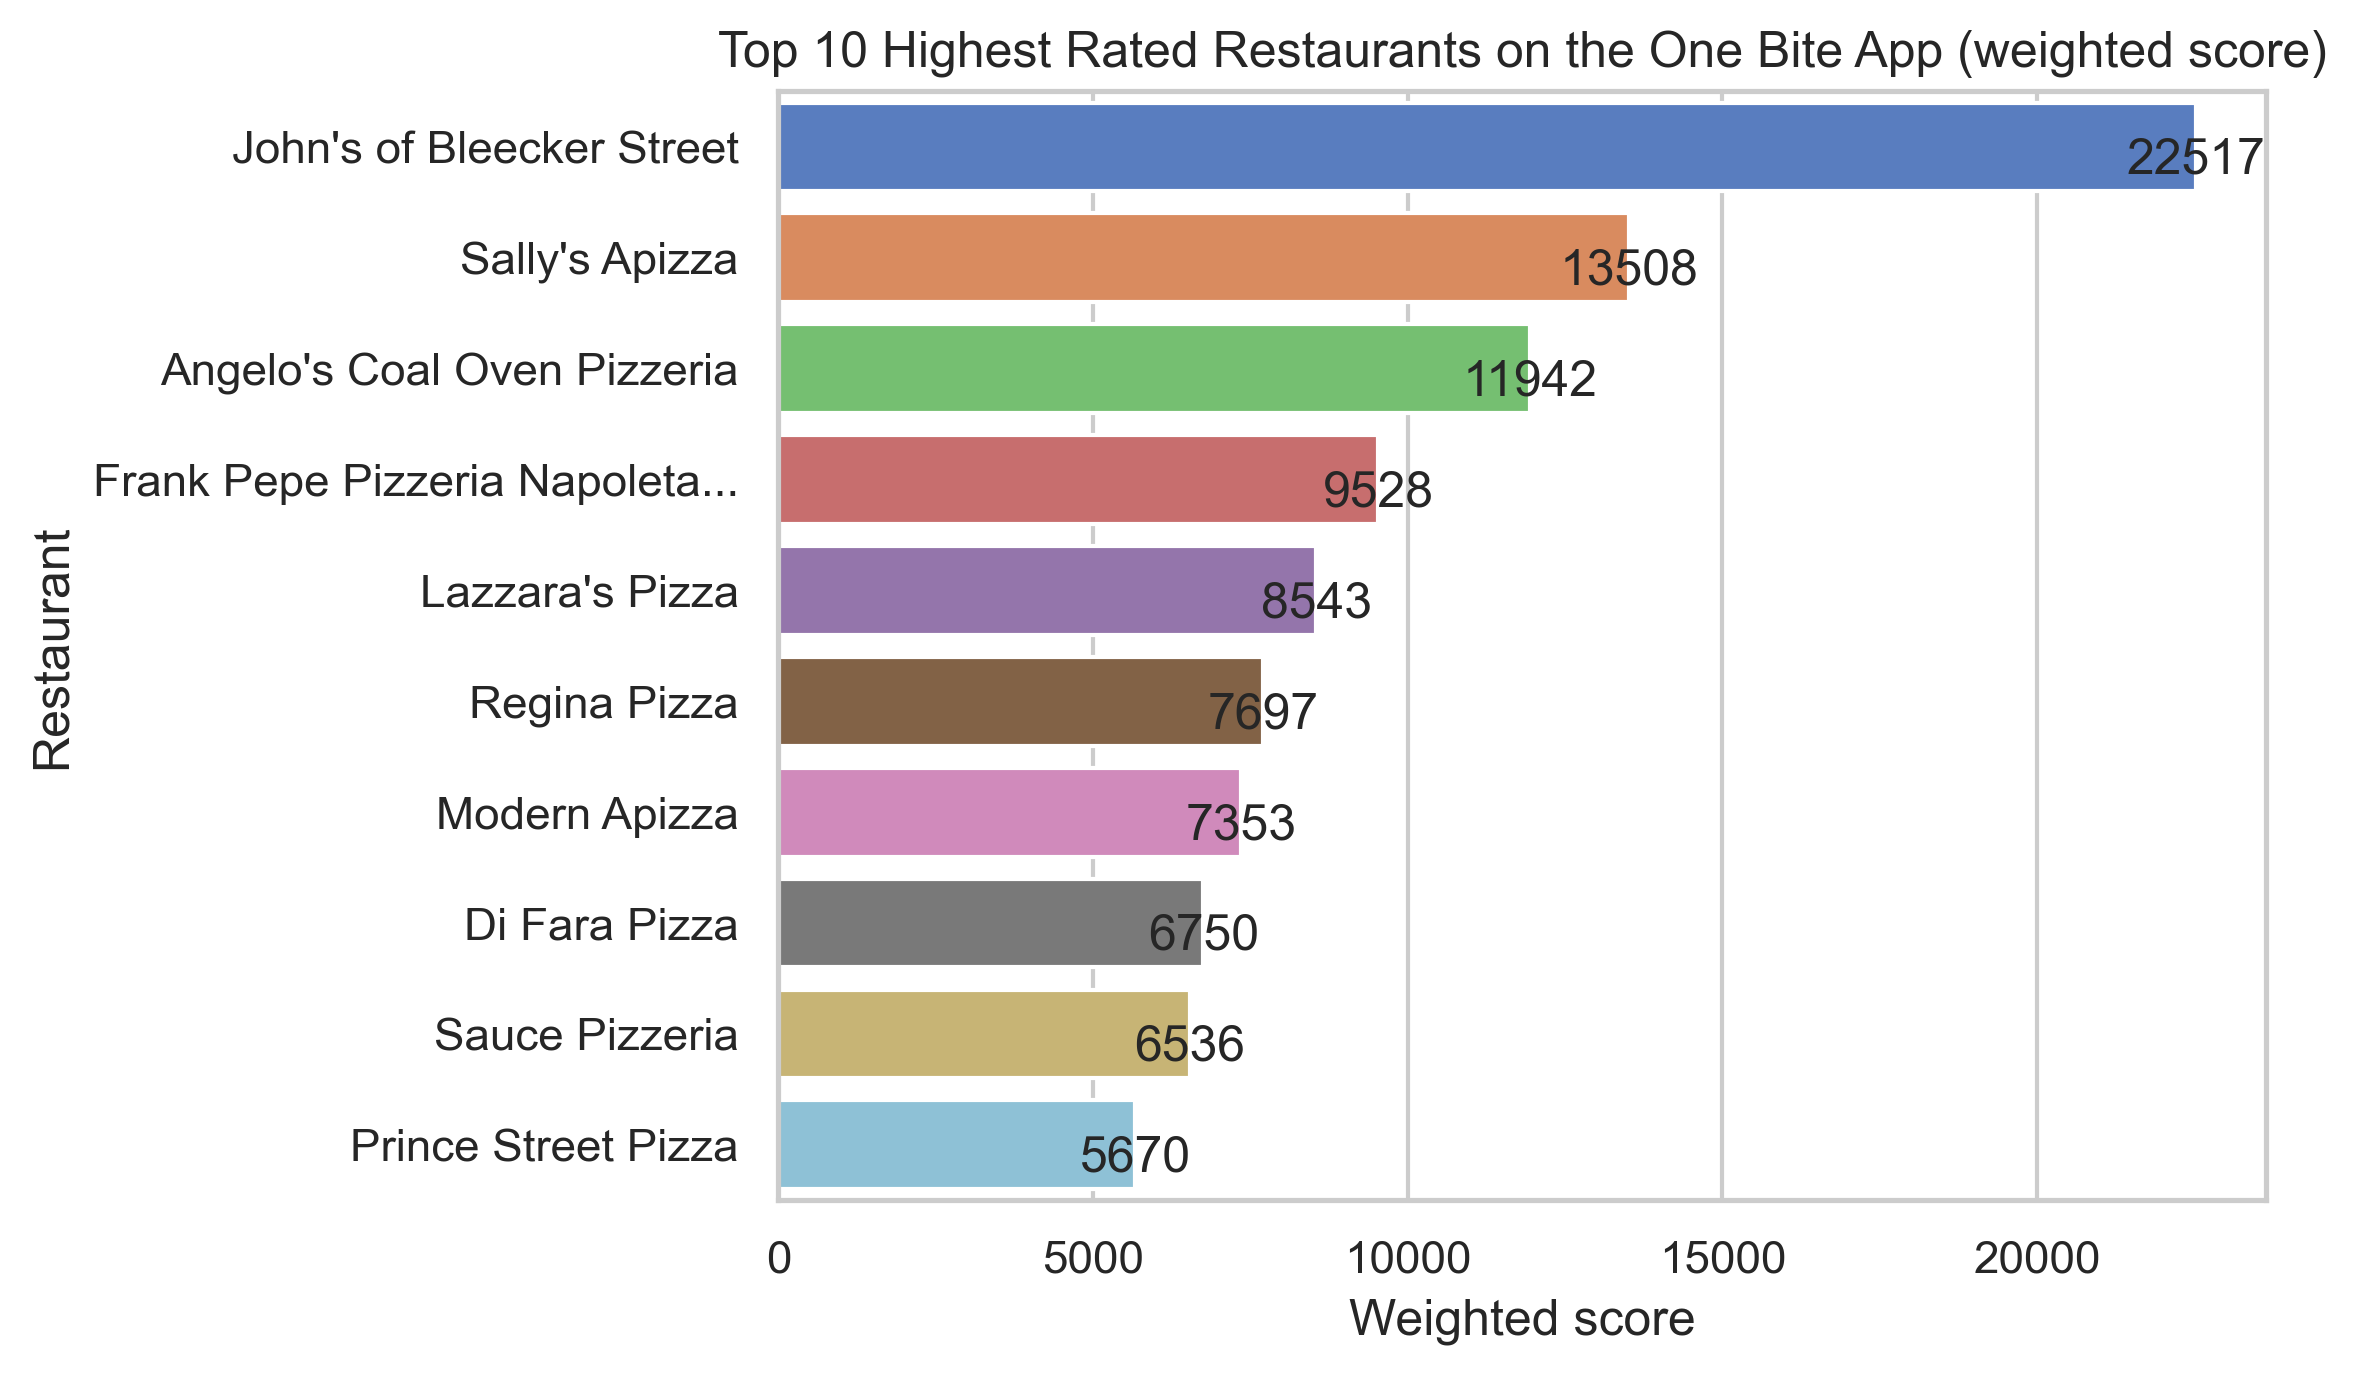
Finally, I wanted to explore the top-rated pizza restaurants in Dave’s review portfolio as well as on the One Bite App. I calculated a weighted average of the average One Bite score given by the users as well as incorporated the number of reviews a restaurant has received on the One Bite App. This gives a more comprehensive and democratic view of the best pizza slices, as it factors in the voice of the masses along with the quantity of the reviews, which adds credibility to the scores. Using this method, I created a list of the top 10 highest-rated restaurants for both and included the worst-rated restaurants as well.
Lowest Scored Pizzas Link to heading
- Open Market - .1
- Amtrak - .1
- 7- Eleven - 0
- BD Pizza - 0
- Blaze Pizza - 0
- LexLive - 0
- Café Muse - 0
- Pizza Hut - 0
- Industry Kitchen - 0
- Dante’s Inferno - 0
Highest Scored Pizzas on the One Bite App Link to heading
Top 10 Highest reviewed restaurants by Dave. Link to heading
- Monte’s Restaurant - 10
- Di Fara Pizza - 9.4
- Frank Pepe Pizzeria - 9.4
- Delucia’s Brick Oven Pizza - 9.4
- John’s of Bleecker St. - 9.3
- Angelo’s Coal Oven Pizzeria - 9.3
- Lucali - 9.3
- Lazzara’s Pizza - 9.3
- Luigi’s Pizza - 9.3
- Sally’s Apizza - 9.2
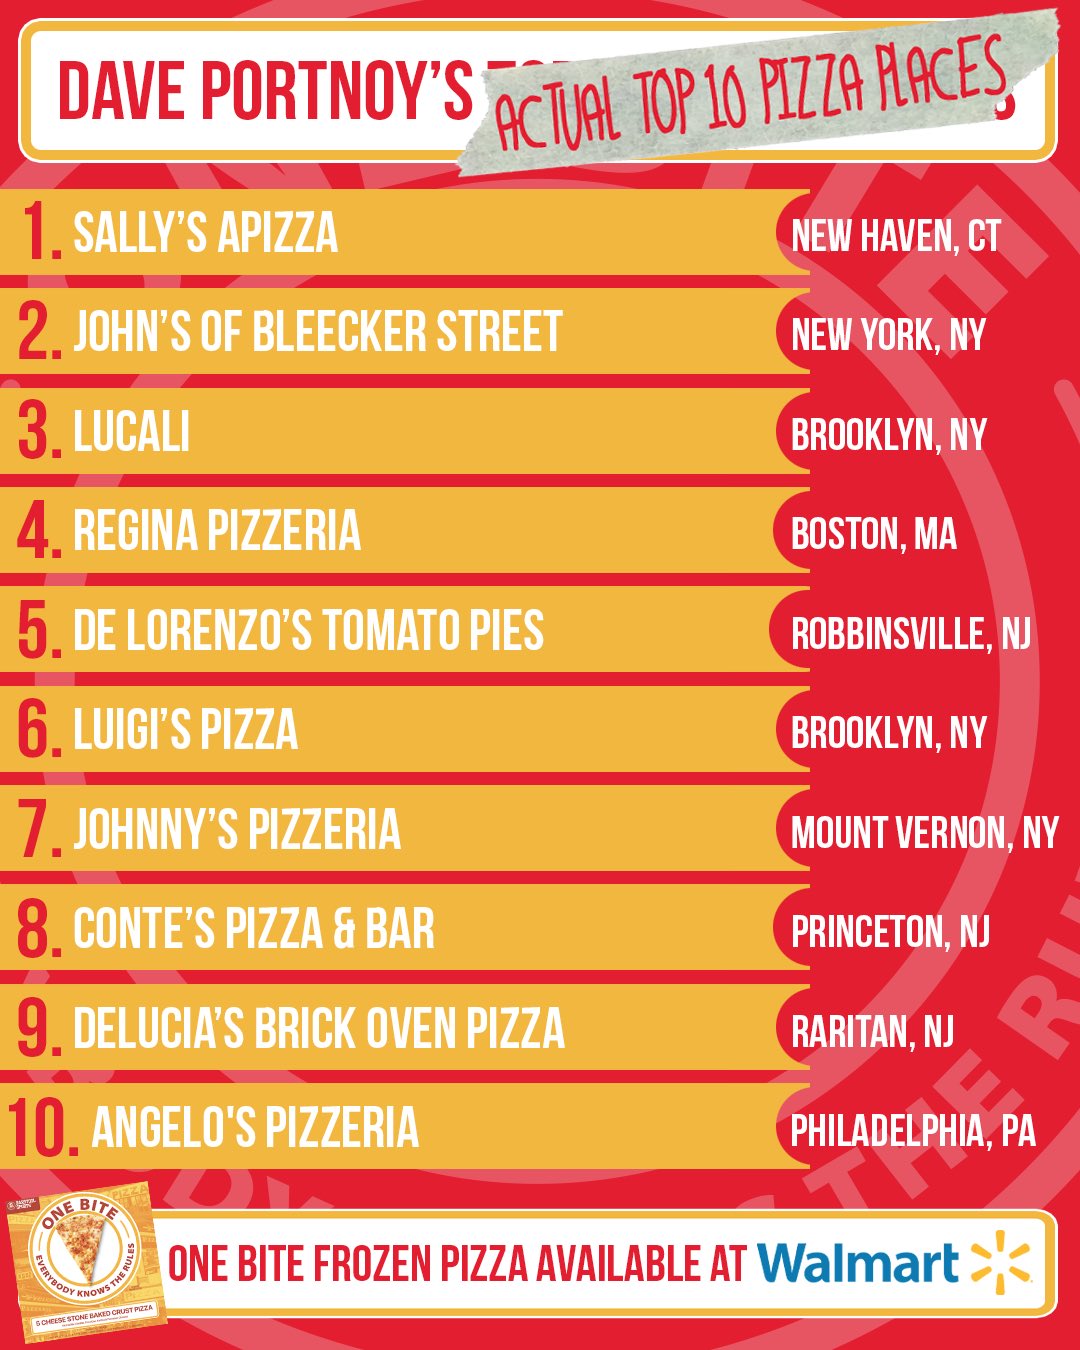
Bouns: Dave Portnoy’s Actual Top 10 Pizza Places Link to heading
Despite all the scores and video reviews rankings, Dave has a different list of restaurants in his personal top 10. Recently on Twitter, Dave shared his real top 10 pizza places saying, “The scores don’t always add up ‘cause I’ve done all my reviews at different times and under different circumstances.”
